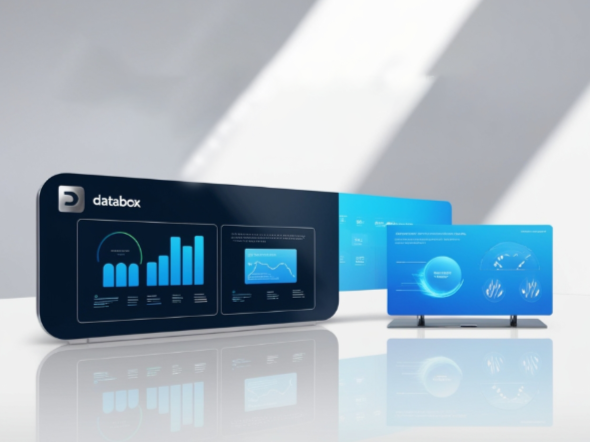
Intro to Databox
Databox pulls all your data into one place, so you can track performance and discover insights in real-time. Users can view all of their performance data in one place and spend less time checking data and creating reports, but more time acting on insights. Mix and match metrics from different sources in one Databoard and get a more complete view of overall performance at a glance.
Integration Features
- The DIY Dashboard Designer lets anyone create visually appealing, customizable dashboards and showcase them on RocketScreens.
- Automatically sync and display real-time performance data from Databox on digital screens through managed by RocketScreens.
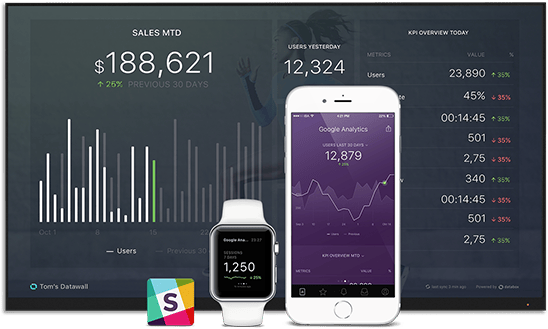
- Display Databox dashboards on various devices, such as TVs, LED displays, and tablets using RocketScreens.
- Dashboards on RocketScreens can be set to refresh automatically at specified intervals, ensuring the latest data is always displayed.
- Schedule Databox dashboards to appear at specific times or rotate through different dashboards on RocketScreens.