Many organizations rely on Salesforce to manage sales, customer service, marketing, and other key operations. However, getting the valuable insights from Salesforce into the hands—and eyes—of employees can be challenging. Traditional reporting methods like emailed spreadsheets or on-demand reports often lead to delays in communication and missed opportunities for timely action.
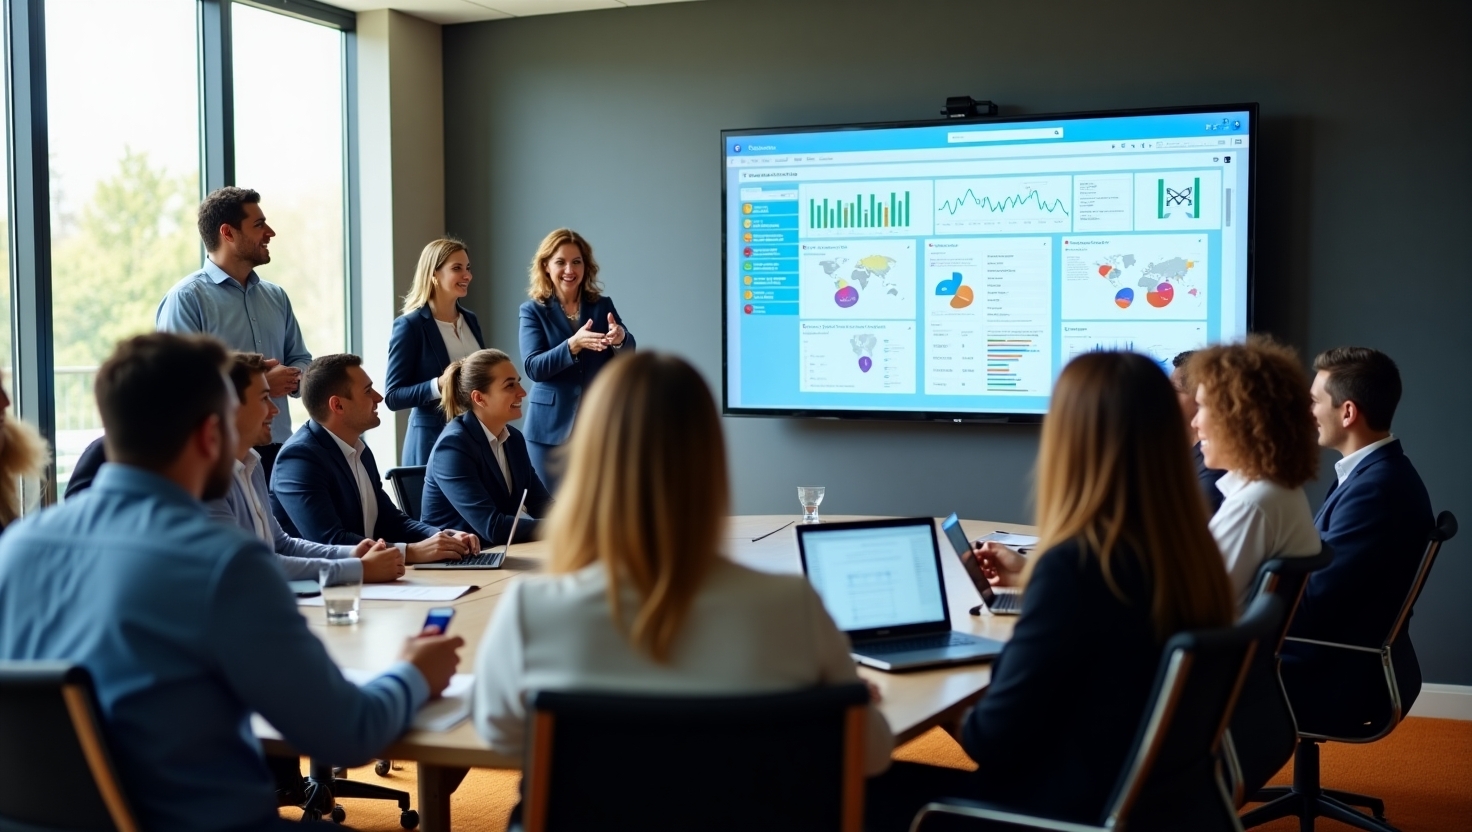
By displaying Salesforce data on TV screens, companies can provide an ambient, real-time overview of performance metrics in common areas such as lobbies, meeting rooms, and sales floors. This method not only ensures that everyone is updated on the latest figures but also creates a focal point for collaboration and discussion.
Digital signage platforms, such as RocketScreens, offer a secure and flexible way to connect Salesforce data to TV dashboards. By integrating with over 100 applications, RocketScreens makes it possible to design and display custom dashboards that meet the unique needs of any organization. In the following sections, we outline 10 creative approaches, each with practical implementation examples and real-world outcomes.
Real-Time Sales Performance Dashboards
One of the most common applications of TV dashboards is to display real-time sales performance. By showcasing metrics such as total revenue, deal closures, and conversion rates, companies ensure that sales teams stay informed and motivated.
Implementation Example
A mid-sized technology firm used a TV dashboard in its sales office to display live updates of its pipeline. Using RocketScreens, the company integrated Salesforce reports directly onto a large screen. The dashboard updated automatically every few minutes, showing real-time figures on deals in progress, total sales closed, and individual performance metrics.
Results & Benefits
-
- Improved Sales Focus: Sales representatives could easily track their progress against targets.
- Increased Accountability: Transparent, live data encouraged healthy competition among team members.
- Quick Reaction: Managers could identify trends and quickly address any issues impacting sales performance.
KPI Leaderboards for Sales Teams
Creating a leaderboard that ranks team members by performance metrics is a popular strategy. This method not only celebrates high achievers but also provides a visual reminder for everyone to strive for better results.
-
Implementation Example
A leading software company implemented a TV dashboard displaying a leaderboard that ranked salespeople by deals closed and revenue generated. The leaderboard was designed using RocketScreens’ drag-and-drop interface, which allowed the company to incorporate Salesforce data seamlessly. Custom visualizations highlighted top performers and provided real-time updates as new sales were recorded.
-
Results & Benefits
- Enhanced Motivation: Public recognition boosted team morale.
- Clear Performance Metrics: Employees could see where they stood and work to improve their rankings.
- Data-Driven Coaching: Managers used the leaderboard to identify areas for coaching and further training.
Customer Service Response Dashboards
In addition to sales metrics, customer service performance is another area that benefits from visual dashboards. Displaying real-time metrics such as ticket resolution times, customer satisfaction scores, and case volumes can help service teams improve their response times.
-
Implementation Example
A global retailer set up a TV dashboard in its customer service center to display key performance indicators from Salesforce. The dashboard included average response times, case backlog numbers, and satisfaction ratings. RocketScreens enabled the company to integrate these Salesforce reports without the need for complex coding, making it simple to keep the data current.
-
Results & Benefits
- Improved Efficiency: Real-time data helped teams quickly identify and address bottlenecks.
- Enhanced Communication: The dashboard served as a constant reminder of performance goals.
- Increased Customer Satisfaction: Faster response times led to improved customer service ratings.
Marketing Campaign Performance Visuals
Marketing teams can benefit from displaying campaign performance metrics on TV screens. By integrating Salesforce data with digital signage, companies can track ad spend, social media engagement, lead generation, and conversion rates.
-
Implementation Example
A consumer goods company used a TV dashboard in its marketing department to display ongoing campaign performance. The dashboard integrated data from Salesforce and other marketing platforms, providing a comprehensive view of key metrics such as cost per lead, social media reach, and website traffic. RocketScreens’ integration capabilities ensured that the data was updated in near real-time.
-
Results & Benefits
- Enhanced Visibility: The marketing team could quickly assess the effectiveness of current campaigns.
- Actionable Insights: Immediate data access allowed for rapid adjustments to strategies.
- Unified Reporting: Combining data from multiple sources provided a holistic view of campaign performance.
Executive Summary Dashboards in Common Areas
Placing dashboards in common areas like lobbies or conference rooms can keep everyone in the organization informed about overall performance. An executive summary dashboard provides a snapshot of key metrics from various departments.
-
Implementation Example
A multinational corporation implemented an executive summary dashboard in its lobby using RocketScreens. The dashboard pulled data from Salesforce to display metrics such as total revenue, pipeline value, customer satisfaction, and employee performance. The information was updated in real time and displayed in an easy-to-read format that was accessible to all employees, including visitors.
-
Results & Benefits
- Organizational Alignment: Everyone in the company was aware of the most critical performance metrics.
- Enhanced Transparency: The dashboard fostered a culture of openness and shared responsibility.
- Improved Decision-Making: Quick access to summary data allowed leaders to make informed decisions on the fly.
Interactive Dashboard Loops for Team Meetings
Dashboard loops that rotate through various Salesforce reports are an effective way to provide comprehensive insights during team meetings. These loops can include different dashboards for sales, customer service, marketing, and finance.
-
Implementation Example
A financial services firm set up an interactive dashboard loop using RocketScreens. During daily stand-up meetings, the TV dashboard cycled through a series of Salesforce reports that highlighted different aspects of the business. The loop was scheduled to display each report for a set duration before moving on to the next one, ensuring that all relevant data was reviewed in a concise manner.
-
Results & Benefits
- Efficient Meetings: Teams could review multiple data points without switching between applications.
- Increased Engagement: The dynamic loop kept employees attentive and fostered discussions around the data.
- Better Collaboration: Having all key metrics visible during meetings helped teams align their strategies.
Employee Recognition and Reward Boards
Celebrating employee achievements by displaying recognition and rewards on TV dashboards is a creative way to boost morale. Using Salesforce data to highlight top performers and celebrate milestones can inspire others to perform better.
-
Implementation Example
A regional sales organization developed a digital recognition board that pulled performance data from Salesforce. The TV dashboard showcased the names, photos, and achievements of employees who met or exceeded their targets. RocketScreens was used to create a visually appealing layout that could be updated automatically as new data became available.
-
Results & Benefits
- Boosted Morale: Public recognition motivated employees to strive for excellence.
- Encouraged Healthy Competition: The competitive element spurred team members to improve their performance.
- Fostered a Positive Culture: The recognition board contributed to a supportive and appreciative work environment.
-
Inventory and Order Management Displays
Retail and manufacturing companies can use TV dashboards to display real-time inventory levels, order statuses, and supply chain data from Salesforce. This visibility helps teams monitor stock levels and manage order fulfillment more effectively.
-
Implementation Example
A large retail chain integrated its Salesforce-based inventory management system with RocketScreens to create a live TV dashboard. The dashboard provided an overview of current stock levels, recent orders, and replenishment needs. By displaying this data in a central location, the operations team could quickly identify potential issues and adjust order processing accordingly.
-
Results & Benefits
- Improved Operational Efficiency: Teams were able to monitor and adjust inventory levels in real time.
- Reduced Stockouts: Early detection of low inventory prevented disruptions in supply.
- Streamlined Order Fulfillment: The dashboard helped coordinate efforts across multiple departments, leading to faster order processing.
Customer Engagement Metrics for Service Desks
For companies that rely on customer interaction, displaying engagement metrics on TV screens in service areas can be highly beneficial. These dashboards might include data such as live chat response times, call volumes, and customer satisfaction scores.
-
Implementation Example
A telecommunications company implemented a TV dashboard in its customer service center to display engagement metrics sourced from Salesforce. The dashboard highlighted real-time data on call wait times, chat volumes, and resolution times. With RocketScreens, the integration was secure and the display was configured to update automatically, providing the service desk with up-to-date insights.
-
Results & Benefits
- Enhanced Service Quality: Real-time metrics enabled the team to quickly identify and resolve service issues.
- Improved Resource Allocation: Data on call volumes and wait times helped managers allocate staff more effectively.
- Better Customer Experiences: The overall service performance improved, leading to higher customer satisfaction scores.
Custom Integrations with External Data Sources
Sometimes, the most effective dashboards combine Salesforce data with information from other systems. This hybrid approach can provide a more comprehensive view of the business and support cross-functional decision-making.
-
Implementation Example
A logistics company wanted to merge its Salesforce sales data with operational metrics from its transportation management system. Using RocketScreens’ robust integration capabilities, the company built a custom TV dashboard that displayed combined data sets. The result was a unified view that showed both sales performance and delivery efficiency, helping the management team make well-informed decisions.
-
Results & Benefits
- Holistic Insights: Combining data from multiple sources allowed for a more comprehensive analysis.
- Cross-Departmental Collaboration: Teams from different departments could access and act on shared information.
- Informed Decision-Making: A unified dashboard helped leadership identify correlations and opportunities across various aspects of the business.
How to Get Started with RocketScreens
RocketScreens simplifies the process of displaying Salesforce data on TV screens. Here’s how you can set up your own digital signage dashboard:
1. Sign Up and Connect
Create an account with RocketScreens and connect your Salesforce instance using the secure integration options. The platform supports over 100 applications, ensuring your Salesforce data is easily accessible.
2. Create Your Channel
Once connected, set up a channel where you can organize various Salesforce dashboards. Whether you need to display sales data, customer service metrics, or marketing analytics, you can group related content into a single channel.
3. Drag and Drop Integration
Use RocketScreens’ user-friendly interface to drag and drop Salesforce apps onto your channel. Customize the layout, set refresh intervals, and add interactive elements without any coding requirements.
4. Deploy to Multiple Screens
Register your TV players—whether they are physical devices, desktop players, or web players—and assign them to the relevant channels. This way, you can display consistent, real-time data across different office locations or departments.
5. Monitor and Update
RocketScreens offers a centralized dashboard where you can manage all screens, schedule content, and ensure that your Salesforce data is always up-to-date. This remote management capability saves time and minimizes manual intervention.
Success Stories and Measurable Results
Companies across various industries have seen tangible improvements by displaying Salesforce data on TV dashboards. Here are a few examples:
- Tech Company Boosts Sales by 15%
By displaying a real-time sales performance dashboard in their sales office, a technology firm improved team accountability and increased overall sales by 15% within six months. The constant visual feedback encouraged representatives to keep pushing toward their targets.
- Retail Chain Enhances Operational Efficiency
A major retail chain implemented an inventory management dashboard that integrated Salesforce data with logistics metrics. This visibility helped reduce stockouts by 20% and improved order fulfillment times significantly.
- Customer Service Center Reduces Response Times
In a customer service setting, a telecommunications company used TV dashboards to display live call and chat metrics. The result was a 10% reduction in average response time, which contributed to higher customer satisfaction scores.
- Cross-Departmental Collaboration Improves Decision-Making
A logistics company that merged Salesforce sales data with operational metrics created a unified view that improved decision-making. The holistic approach enabled management to identify trends and adjust strategies across both sales and operations, leading to better overall performance.
These success stories illustrate how effective visual communication can drive measurable improvements in business performance. By leveraging TV dashboards to showcase Salesforce data, companies not only keep their teams informed but also empower them to act on real-time insights.
Best Practices for Creating Effective TV Dashboards
To get the most out of your digital signage solution, consider the following tips:
1. Prioritize Key Metrics
-
- Focus on Actionable Data: Identify the most important metrics for your team—whether it’s sales performance, customer service response times, or campaign effectiveness—and ensure these are prominently displayed.
- Keep It Simple: Avoid clutter by limiting the number of data points on each screen. Use clean, straightforward visualizations that are easy to understand at a glance.
2. Ensure Regular Updates
-
- Set Appropriate Refresh Intervals: Depending on the nature of the data, choose refresh intervals that balance real-time accuracy with system performance.
- Automated Updates: Leverage integration tools like RocketScreens to automate data updates, reducing the need for manual intervention.
3. Tailor Dashboards to the Audience
-
- Custom Views for Different Departments: Create different dashboard channels for sales, marketing, customer service, and other teams. This ensures that each department sees the most relevant data.
- Feedback and Iteration: Gather feedback from end users and continuously refine dashboard layouts and metrics to better meet their needs.
Conclusion
TV screens that display Salesforce data provide a practical solution to keep employees engaged, accountable, and informed in real time. From live sales performance metrics to comprehensive executive summaries, the creative methods discussed in this guide demonstrate how companies can leverage digital signage for improved collaboration and decision-making.
With platforms like RocketScreens, setting up a secure, real-time integration is straightforward and cost-effective. By making key data visible to everyone in the organization, companies can drive performance improvements, enhance customer satisfaction, and support overall business growth.
Whether you are looking to motivate your sales team with a dynamic leaderboard, streamline customer service operations, or create a unified view that blends multiple data sources, there is a TV dashboard use case that can meet your needs. Explore the potential of these salesforce display examples and see firsthand how effective tv dashboard uses can transform the way your organization interacts with data.


