Your teams rely on Datadog. It's the central nervous system for your infrastructure, applications, and security protocols. Every minute, it processes a torrent of metrics, logs, and traces that tell the story of your system's health. The insights are all there, but they often remain hidden on the laptops of individual engineers or behind a login wall. What if you could take that critical information and make it a visible, persistent part of your team's environment?
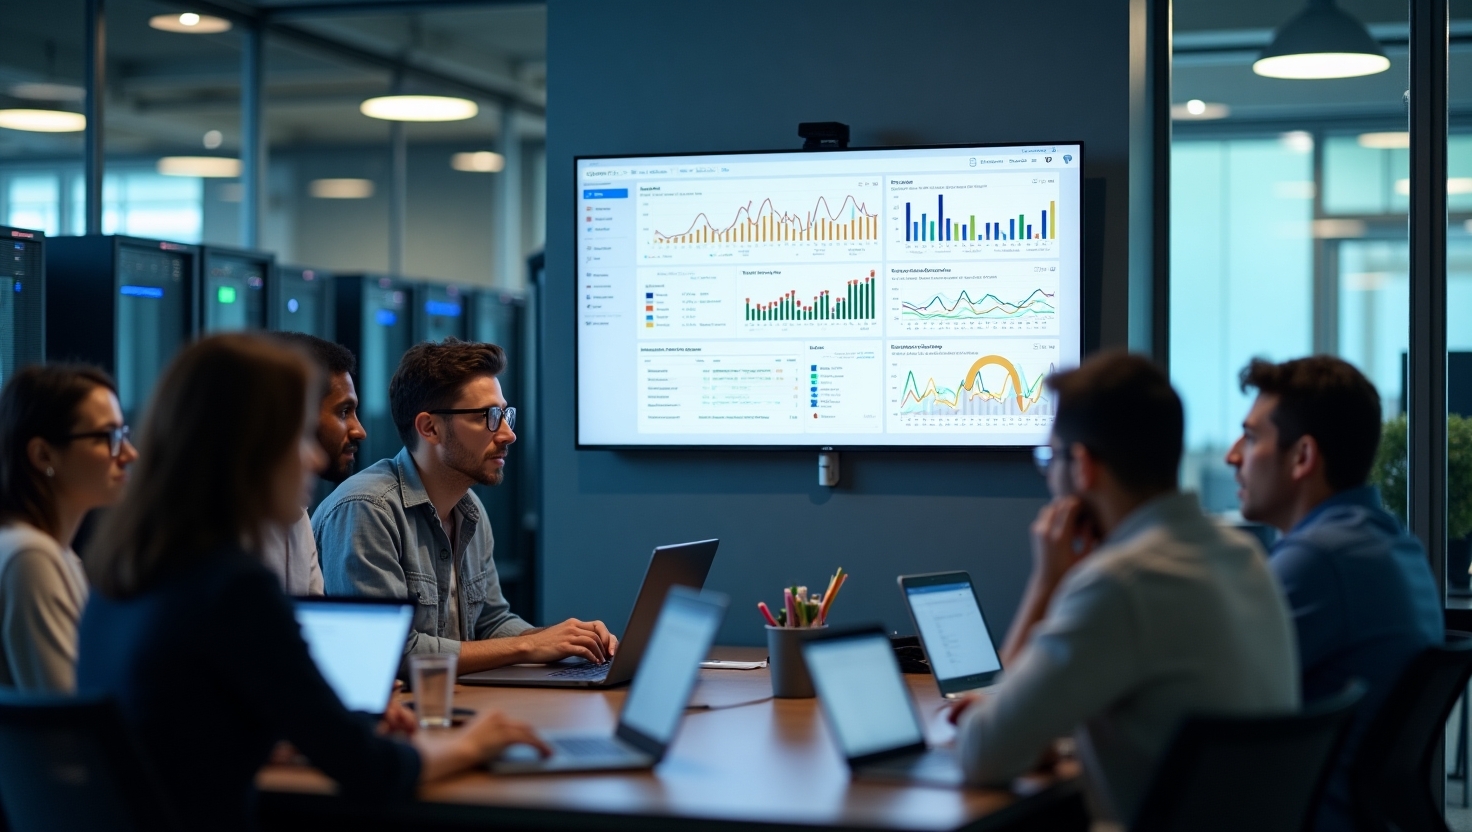
Putting key Datadog dashboards on large TV screens throughout your office isn't just about aesthetics; it's a strategic move to change how your teams consume and react to data. When information is ambient, it moves from being a reactive tool for a few to a proactive guide for everyone. This guide explores why displaying Datadog metrics on screens is beneficial for modern IT and DevOps teams and shows how to do it securely and efficiently.
Why Share Datadog Metrics on a Big Screen?
Moving data from a personal monitor to a shared wall display creates a fundamental shift in team dynamics and operational awareness. It turns passive data consumption into an active, communal experience that drives tangible improvements in performance and culture.
Fostering a Proactive Culture
When a potential issue starts to trend in the wrong direction—like slowly increasing latency or rising memory usage—it can go unnoticed for hours if the right person isn't actively looking at the right dashboard. When that graph is displayed on a 65-inch screen in the middle of the workspace, it becomes a shared point of reference. Team members can spot anomalies organically, discuss them casually, and investigate them before they escalate into service-degrading incidents. This visibility encourages a culture of proactive maintenance rather than reactive firefighting.
Improving Incident Response Times
When an alert fires, the clock starts ticking. The traditional workflow involves a notification through Slack, PagerDuty, or email, which then requires someone to open their laptop, log in, and diagnose the problem. By displaying your critical alert dashboards publicly, you shorten that discovery cycle dramatically. The moment a metric crosses a threshold and turns red on the screen, the entire team is aware. This immediate, shared context allows for faster collaboration. An SRE can point to the screen and ask a developer, "Did that last deployment cause this spike?" The conversation happens in seconds, not after a chain of messages.
Aligning Teams with Key Performance Indicators (KPIs)
Service Level Objectives (SLOs) and Service Level Agreements (SLAs) are promises to your users and customers. Are you meeting them? Too often, the status of these crucial goals is buried in a quarterly report. Displaying your SLO dashboards—showing uptime, error budgets, and performance against targets—keeps these commitments top of mind every day. This applies not just to engineering teams but to everyone. When the customer support team can see that a core service is experiencing high latency, they are better equipped to handle incoming calls. When the product team sees how a new feature impacts resource usage, they can make better decisions for the next sprint.
Breaking Down Data Silos
In many organizations, specialized data lives with specialized teams. APM data is for developers, infrastructure metrics are for Ops, and security logs are for the SecOps team. While specialization is necessary, it can create information silos that hinder collaboration. A shared digital signage screen acts as a data commons. It exposes different teams to each other's key metrics, fostering a broader understanding of how the entire system works. A developer might notice a pattern in network traffic that impacts their application, sparking a conversation with the infrastructure team that might not have happened otherwise.
What Datadog Information Should You Display?
The power of Datadog lies in its breadth and depth. The key to effective digital signage is to be selective and display the information that provides the most value at a glance. You want dashboards that are easily understood from a distance and communicate status clearly through colors and trends.
Key Infrastructure Metrics
This is the foundation of any Network Operations Center (NOC) or IT monitoring setup. These dashboards give you a high-level view of the health of your physical or virtual hardware.
- CPU Utilization: Show aggregated CPU load across a cluster or for critical services.
- Memory Usage: Track memory consumption to prevent out-of-memory errors.
- Disk I/O: Monitor read/write operations to identify storage bottlenecks.
- Network Traffic: Display inbound/outbound traffic patterns to spot unusual activity or capacity limits.
Application Performance Monitoring (APM) Data
For DevOps and development teams, APM metrics are the pulse of the application. These dashboards help connect code performance to user experience.
- Request Latency (p95, p99): Show the response time for the 95th and 99th percentile of users to understand the experience of your slowest users, not just the average.
- Error Rates: A simple graph showing the rate of 4xx and 5xx errors is one of the most effective ways to monitor application health.
- Throughput: Display requests per minute or per second to visualize traffic load and how your system scales.
- Service Maps: A visual representation of microservice dependencies, color-coded by health, is perfect for a large screen.
Log Analytics and Patterns
Raw logs are too dense for a dashboard, but aggregated log data is incredibly useful.
- Error Log Counts: Track the frequency of specific error messages or keywords over time.
- Event Trends: Monitor the volume of certain events, such as user logins or failed payment transactions.
Security Signals and Threats
For a Security Operations Center (SOC), real-time visibility is non-negotiable. Datadog Security Monitoring can feed dashboards that keep the whole team alert.
- High-Priority Security Signals: A dedicated list or count of critical threats detected by the platform.
- Geographic Threat Map: A map showing the origin of anomalous login attempts or potential attacks.
- Firewall Activity: Visualize blocked and allowed traffic patterns on key network segments.
Business-Level Dashboards
Connect technical performance to business outcomes. This is excellent for executive-facing screens or for aligning teams with company goals.
- User Sign-up Funnel: Track users moving through the sign-up process, correlated with any application errors.
- E-commerce Transactions: Show successful transactions per minute alongside system uptime.
- Feature Adoption: Monitor the APM metrics for a newly launched feature to see how it's performing under real-world load.
The Challenge: Getting Datadog onto Your Screens
So, you are convinced. You want your key dashboard on a TV. The seemingly obvious solution is to hook up a small computer, like an Intel NUC or a Raspberry Pi, to the back of a screen, open a web browser, and log in to Datadog. This "DIY" approach works, but it quickly introduces a host of technical and security challenges that make it impractical to scale.
The problems with the DIY method include:
- Security Risks: Leaving a browser logged into your company's main Datadog account on a semi-public device is a significant security risk. Session cookies can be stolen, or an unattended screen could grant access to sensitive data. Using read-only users helps but doesn't solve the management problem.
- Maintenance Overhead: Each of these mini-computers is another endpoint to manage. They need software updates, they crash, they require reboots, and someone has to manually re-launch the browser and log back in every time there's a power flicker. For one screen, it's an annoyance. For ten screens, it's a full-time job.
- Lack of Scalability: How do you change the dashboard on 20 screens at once? You have to physically access each device or set up complex remote desktop solutions. There is no central control.
- Limited Functionality: The screen can only show one thing: the browser window. You can't schedule content, mix your Datadog dashboard with other information (like a calendar or company announcements), or create layouts with multiple data sources.
The Simple Solution: Using Digital Signage for Datadog
A dedicated digital signage platform bypasses these challenges entirely. Instead of treating the screen as a dumb monitor for a PC, this approach uses a purpose-built system designed for secure, scalable, and manageable content delivery.
The Power of Integration
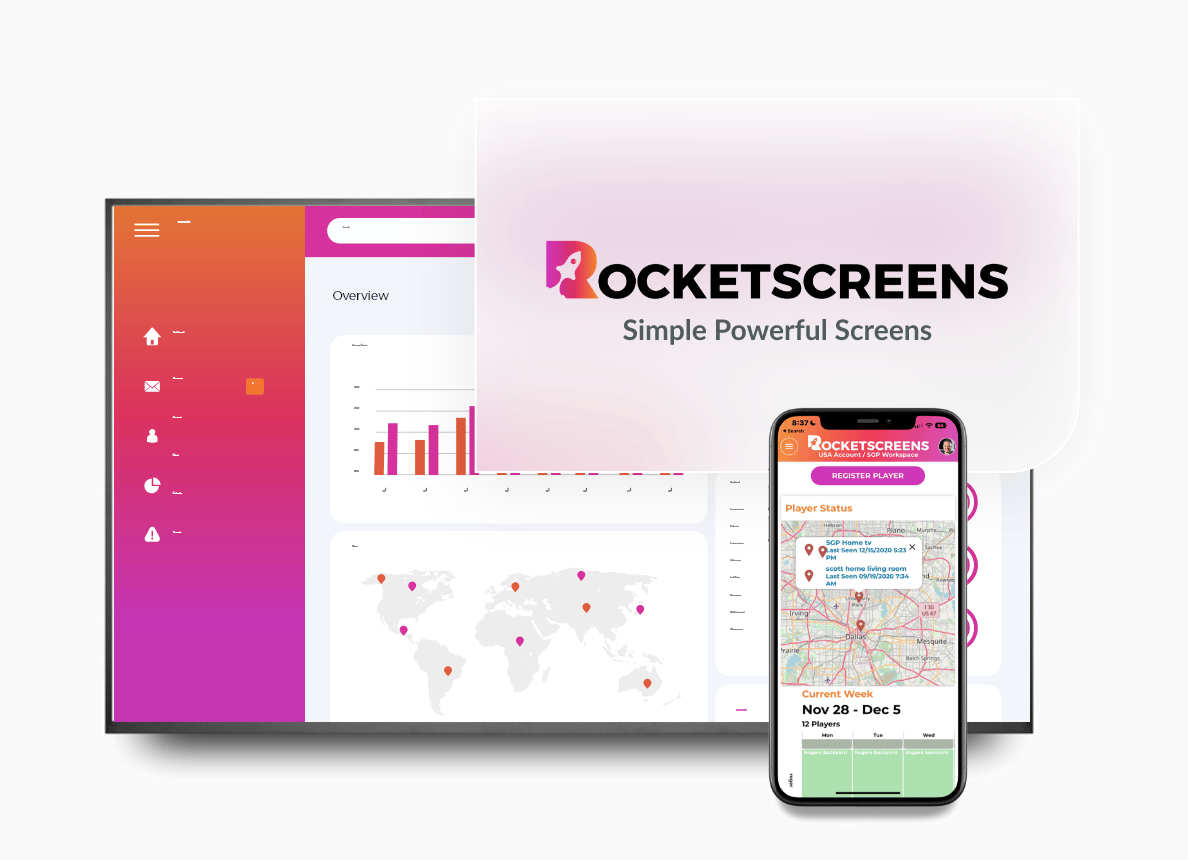
This is where RocketScreens changes the equation. A modern digital signage platform doesn't just mirror a browser. It integrates directly with your data sources through secure APIs. RocketScreens provides a direct, secure connection to your Datadog account. You authorize the connection once, and the platform handles the rest.
This method is superior for several reasons:
- Security First: Authentication is handled via secure API keys or OAuth tokens that can be permissioned for read-only access. You never have to save your primary login credentials on a display device. All communication is encrypted, and access can be revoked centrally at any time.
- Zero-Maintenance Endpoints: The screen hardware—whether it's a small RocketScreens device or a smart TV app—is simple and stable. It does one job: securely display the content sent from the central platform. There are no browsers to manage or sessions to refresh.
- Centralized Control: From the RocketScreens web platform, you can control one screen or a thousand screens across multiple office locations. Change a dashboard, update a layout, or schedule content for your entire fleet of displays in a few clicks.
- Dynamic Content: Don't limit your screens to just Datadog. A key advantage of a platform like RocketScreens is the ability to combine data sources. Create a data wall that shows your Datadog APM dashboard next to your Jira sprint progress, your sales team's Salesforce dashboard, and the company's LinkedIn feed. You can also schedule content—show critical IT metrics during business hours, then switch to company culture content in the evening.
A Step-by-Step Guide: Displaying Datadog with RocketScreens
Getting your vital metrics out of Datadog and onto a screen with a platform like RocketScreens is a straightforward process that prioritizes security and simplicity.
Step 1: Connect Your Datadog Account
The first step is to authorize RocketScreens to access your Datadog dashboards. This is typically done within the RocketScreens platform by adding Datadog as a new application. You will be prompted to provide an Application Key and an API Key from your Datadog account. It's best practice to create a dedicated, read-only user in Datadog specifically for this purpose to follow the principle of least privilege. This ensures the connection only has permission to view dashboards and nothing more.
Step 2: Select Your Dashboard
Once connected, RocketScreens can access the dashboards you've made available via Datadog's public URL feature. In your Datadog account, navigate to the dashboard you want to display and generate a shared public URL. You then simply paste this URL into RocketScreens. The platform will securely access and render this dashboard as a piece of content you can add to any screen.
Step 3: Configure Your Screen Layout
This is where the flexibility of a real digital signage platform shines. You can choose to have your Datadog dashboard display full-screen for maximum impact in a NOC or SOC environment. Alternatively, you can use the layout editor in RocketScreens to create zones. For example, you could have your main Datadog chart occupy 70% of the screen, with the remaining 30% split between a feed of high-priority Jira tickets and a company-wide calendar.
Step 4: Deploy to Your Screens
With your content and layout configured, the final step is to push it live. Simply select the screen or group of screens you want to target and apply your new content channel. The RocketScreens platform sends the instructions to the designated displays, and your Datadog dashboard appears on the wall within seconds. The content will stay fresh automatically, reflecting the real-time data from your Datadog account without any manual intervention.
Real-World Use Cases for Datadog on Digital Signage
Let's see how different teams put this into practice.
The DevOps Team Hub
In the main work area for the platform engineering team, a large TV screen displays a rotating carousel of dashboards. One shows the health of the CI/CD pipeline, including build success rates and deployment times. The next shows key APM metrics for their production environment, latency, error rate, and throughput. This shared view keeps the entire team aligned on both development velocity and operational stability.
The Network Operations Center (NOC) Wall
A classic use case, the NOC is defined by its wall of screens. RocketScreens can power this entire wall. Multiple large displays show a global infrastructure map from Datadog, with color-coding for latency between regions. Another screen is dedicated to high-priority alerts, ensuring nothing is missed. A third screen shows long-term trends for capacity planning, like network bandwidth and storage usage over the past month.
The Executive Briefing Room
On a screen in a meeting room frequented by leadership, a simplified dashboard translates technical metrics into business KPIs. It shows the uptime percentage against the 99.99% SLA, the number of active users on the platform right now, and the conversion rate of the checkout funnel. This keeps technical performance tied to business objectives and provides stakeholders with a clear, live view of platform health.
The Customer Support Floor
The customer support team's office has a screen showing a curated Datadog dashboard. It displays the error rate and response time for the top 5 most used customer-facing features. When a spike in calls comes in about the application being slow, the team can glance at the screen and see if there's a known issue. This provides immediate context, reduces escalation time to engineering, and allows them to communicate more effectively with customers.
Your Datadog data is one of your most valuable assets. Don't leave it locked away on individual computers. By moving it to shared screens, you create a more informed, aligned, and responsive organization. The technical and security hurdles that once made this difficult are solved by modern digital signage platforms. With a secure integration, you can easily and safely turn your real-time metrics into a powerful tool for team-wide communication.
Ready to see your Datadog metrics on the big screen? Explore the RocketScreens Datadog integration and see how simple it can be to share your data anywhere.


