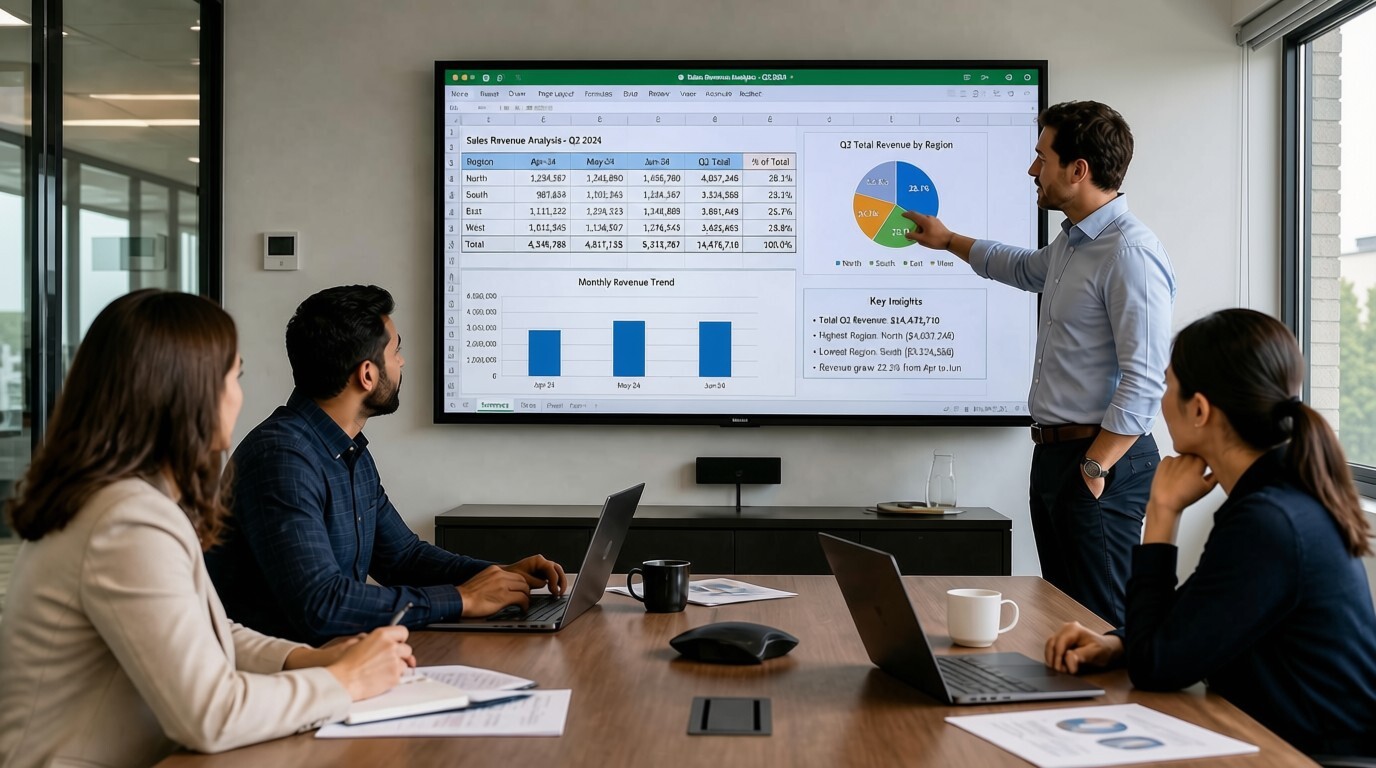
Most teams already run their business inside Excel. Targets, pipeline, ticket queues, and project status usually live in a spreadsheet that only a few people open. When you display Excel reports on TV screens, those numbers stop hiding inside a file and become part of the room. The team sees the same data all day, without logins or extra clicks, and starts acting on it faster.
This guide explains what an Excel-on-TV setup actually does, why it changes team behavior, and how to build one using tools you already have.
What it means to display Excel reports on TV screens
Displaying Excel on a TV is the practice of taking a live or regularly refreshed spreadsheet view and showing it on office screens as an always-on dashboard.
You are not printing a static chart or emailing a PDF. You are keeping Excel as the data layer and pushing a clean, readable version of it to a screen that updates on its own.
The result is a wallboard: a fixed display of the metrics your team acts on, visible from across the room, refreshing without anyone touching it.
Why visible data matters for organizations
Data only changes decisions when people actually see it. A dashboard buried in a shared drive does nothing if no one opens it.
Putting reports on a screen removes that friction. Three shifts tend to follow:
- One source of truth. Everyone looks at the same numbers, so conversations move from "which sheet is correct?" to "what do we do next?"
- Ambient awareness. Instead of checking a report once a day, the team absorbs trends passively throughout the day.
- Shared context. New hires, visiting managers, and cross-functional teams all read the same live picture without a briefing.
Visibility is the mechanism. The screen simply makes the data impossible to ignore.
The business and operational impact
When Excel reports run live on screens, the gains usually show up in three areas: speed, alignment, and accountability.
Faster decisions and issue response
Problems appear on the screen the moment they exist, not in the next standup or email digest. A spike in open tickets, a stalled campaign, or a missed daily target becomes visible in real time.
Teams can redirect resources, escalate, or adjust in minutes instead of hours.
Better alignment and fewer status meetings
A shared screen answers "where are we?" before anyone has to ask. That reduces the number of status meetings and shortens the ones that remain.
Departments coordinate around the same targets and timelines, which cuts down on rework caused by people acting on stale numbers.
Stronger accountability and motivation
Public progress toward a goal increases ownership. When people can see a gap between actual and target, they course-correct on their own.
Leaderboards, revenue counters, and resolution metrics create momentum and healthy competition without a manager repeating the numbers.
What to show from Excel
Show only what your team acts on daily. A screen crowded with every metric becomes wallpaper that no one reads.
Practical examples by function:
- Sales and marketing: pipeline value, deals closed today and this week, ad spend versus target, lead response time, ROAS.
- Support and operations: open tickets, SLA breach risk, average resolution time, uptime, throughput.
- Projects: tasks completed versus planned, active blockers, milestone countdowns, budget burn.
Format each metric as a large KPI card, gauge, or trend line so it reads clearly from across the room. Aim for three to five key numbers per screen.
How to turn Excel into a live TV dashboard
You do not need to rebuild your reporting in a new tool. A workable pattern uses your existing sheets.
- Keep Excel as the data layer. Use your current formulas, tables, and data connections. Nothing about your source workflow changes.
- Build a dedicated "TV view" sheet. Create one clean tab with large fonts, high contrast, and only the KPIs that matter, laid out for a 16:9 screen.
- Set the data to refresh. Use Excel's built-in refresh for connected data or scheduled recalculation so the file updates on its own.
- Push it to the screen. Use a TV dashboard platform that displays your Excel view and auto-refreshes it on office screens without manual work.
RocketScreens integrates directly with Microsoft Excel to show live data on TVs without any coding. Because it runs on a secure cloud-based architecture with centralized screen management, teams can update the underlying sheet and let every connected screen reflect the change automatically.
Industry use cases
The Excel-on-TV pattern fits almost any team that tracks numbers in a spreadsheet.
- Marketing agencies: a client wallboard showing ad spend, ROAS, and content output keeps account teams focused on target attainment.
- Sales floors: live deal counters and quota progress drive daily pace and reduce end-of-month surprises.
- Support centers: queue depth and SLA risk on a screen let team leads rebalance staff before breaches happen.
- Manufacturing and warehouses: throughput, downtime, and safety counters give floor teams a shared operational picture.
- Finance and operations: budget burn and cash position dashboards keep leadership aligned without a weekly export.
For organizations running several offices, multi-location scalability matters. A cloud platform lets one team manage which report shows on which screen across every site from a single place.
Common challenges and how to handle them
Most Excel-on-TV projects stall for predictable reasons. Knowing them upfront saves weeks.
- Stale data. A screen showing yesterday's numbers erodes trust fast. Confirm your refresh schedule matches how often the team needs the data.
- Cluttered layouts. A full spreadsheet on a TV is unreadable. Build a separate view sized for distance viewing.
- Manual updates. If someone has to open a laptop and re-share the file each morning, it will lapse. Automate the display and the refresh.
- Screen sprawl. Adding screens without central control leads to inconsistent, outdated displays. Manage them from one dashboard.
Best practices for Excel TV dashboards
A few design and process habits separate a useful wallboard from ignored background noise.
- Design for distance. Big fonts, high contrast, limited color, and three to five metrics per screen.
- Rotate views when needed. Show sales in the morning and support in the afternoon, or cycle through departments on a set schedule.
- Tie metrics to owners. Label each KPI with a team or person to lift engagement and accountability.
- Use real-time dashboards where it counts. Reserve live refresh for metrics that drive same-day action; a daily refresh is fine for slower numbers.
- Measure the impact. Track whether status meetings shorten, response times improve, or target attainment rises after going live.
Mistakes to avoid
Teams tend to repeat the same errors when they first put reports on screens.
- Showing everything. More metrics do not mean more insight. They usually mean the screen gets ignored.
- Treating it as decoration. A dashboard that no one is expected to act on becomes invisible within a week.
- Skipping ownership. Metrics with no name attached rarely get a response when they slip.
- Ignoring reliability. A screen that freezes or drops offline teaches the team to stop trusting it. Enterprise-grade reliability is the point, not a nice-to-have.
Frequently Asked Questions
Can I display an Excel report on a TV without special software?
You can mirror a laptop to a TV manually, but it will not refresh on its own and someone has to keep the file open. A dedicated TV dashboard platform displays the Excel view and updates it automatically, which is what makes it sustainable.
Does my Excel data update in real time on the screen?
It updates as often as you configure. Connected data sources can refresh on a schedule, and the display reflects each refresh. For live operational metrics, set a short refresh interval; for slower numbers, a daily refresh is enough.
How many metrics should I show on one screen?
Three to five key metrics per screen is the practical limit for readability from across a room. If you need more, rotate views or use additional screens rather than crowding one display.
Can I display different reports across multiple office locations?
Yes. A cloud-based platform with centralized management lets you assign specific reports to specific screens across every site and control all of them from one place.
Will this replace our BI tools like Power BI or Tableau?
No. Excel-on-TV complements them. Many teams display Excel, Power BI, and other sources side by side. The goal is visibility of the data you already trust, not a migration.
Put your Excel reports on the wall
If your team already lives in spreadsheets, the fastest way to lift speed, alignment, and accountability is to make those numbers impossible to ignore. RocketScreens connects to Microsoft Excel and 100+ other integrations to show live reports on your office screens, managed centrally and built for multi-location scale.
Book a demo or start a consultation to see how quickly your existing Excel reports can become always-on team dashboards.