Jira dashboards are among the most widely used project-tracking tools in software and IT teams worldwide. But most of the time, they sit inside a browser tab, opened briefly before a standup and closed just as fast. If you want to display Jira dashboards on TV screens across your office, this guide walks you through how to do it, what options exist, where each falls short, and how to build a setup that actually scales.
Why Visibility Is the Missing Link in Jira
Jira is built to track issues, sprints, queues, and project progress in detail. The problem is not the data, it is how often people actually see it. Most teams open Jira on-demand, which means metrics are only reviewed during scheduled meetings. Between those meetings, problems accumulate silently.
A burndown going flat, a support queue filling up, a sprint nearing its end with half the issues still open, these are patterns that benefit from ambient visibility. When the data is always on a screen in the room, teams notice problems earlier and act faster.
This concept is sometimes called an "information radiator": a display that broadcasts operational data continuously to everyone in a space, without requiring them to log in or pull a report. Office TVs are the most practical way to create that effect with Jira data.
What Jira Dashboards and Wallboards Can Do
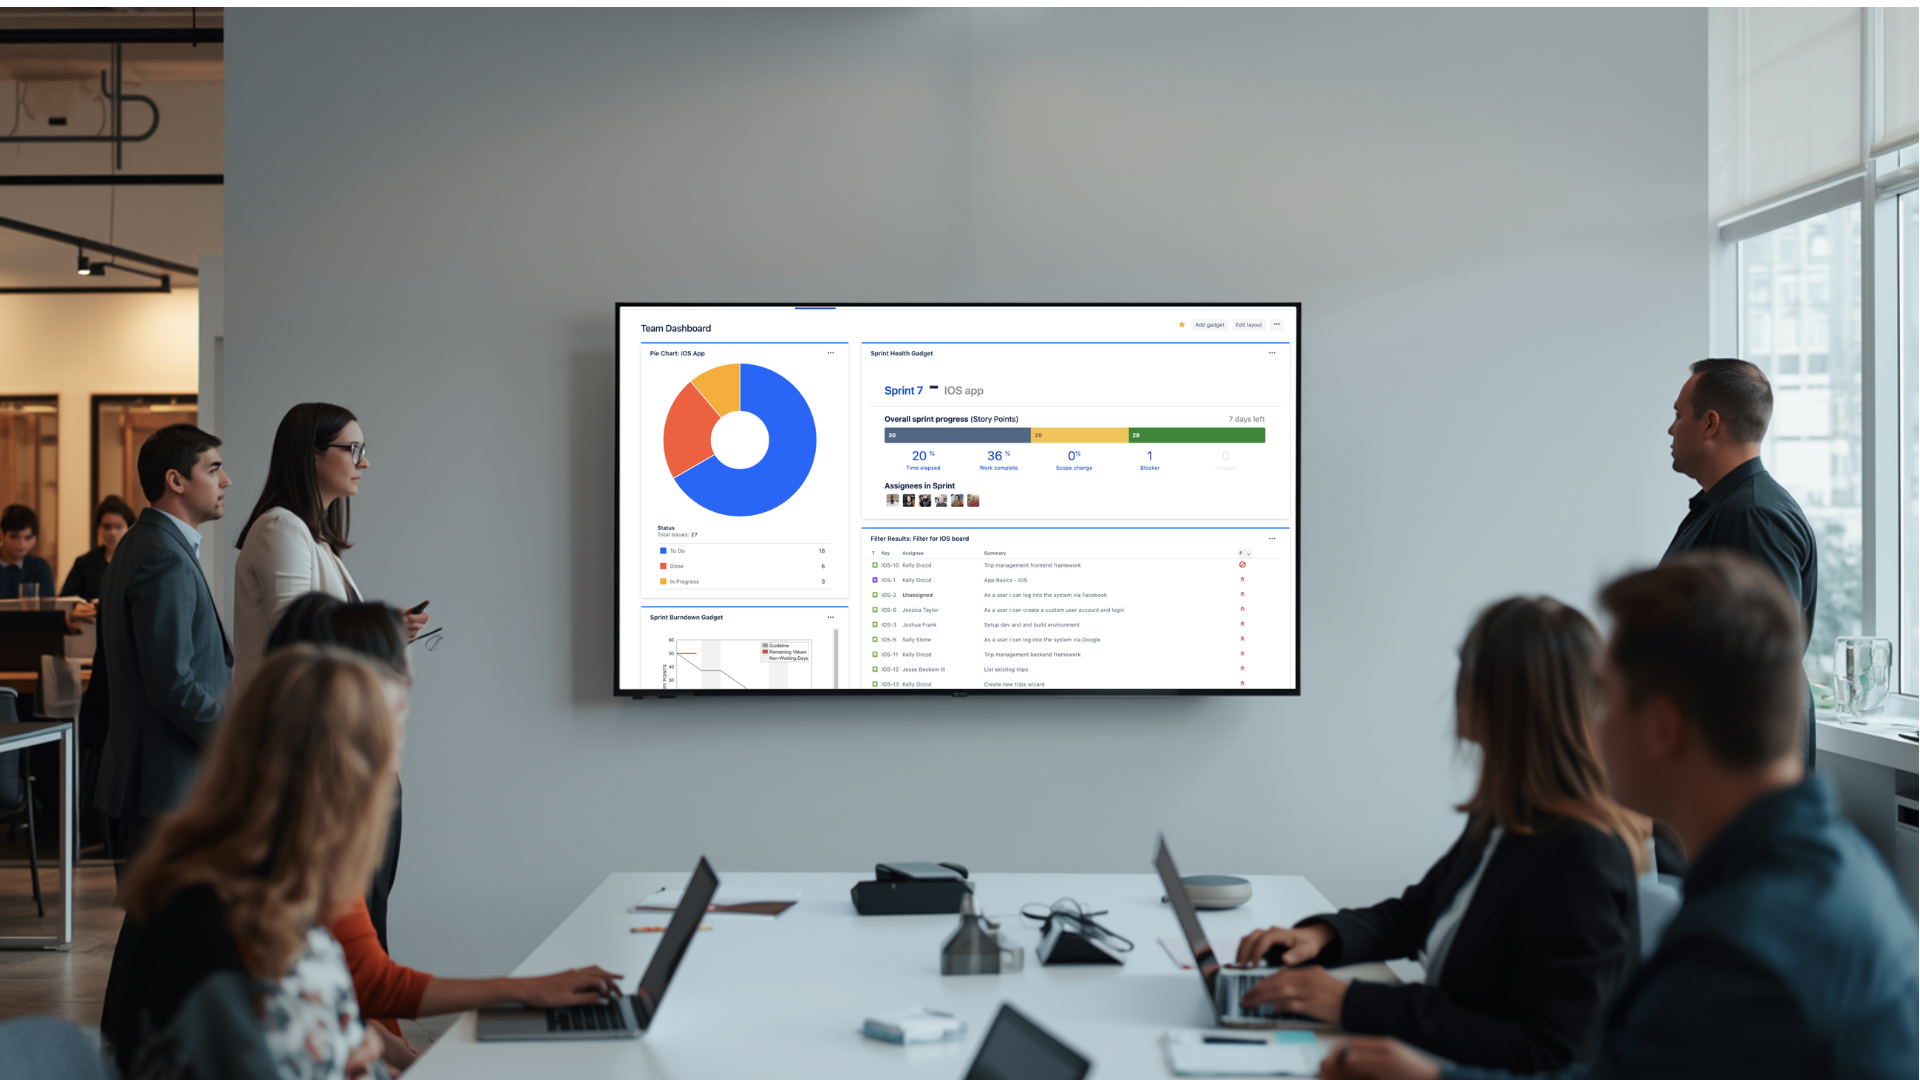
Jira dashboards are configurable views made up of gadgets, components that display sprint progress, issue counts, burndown charts, created vs. resolved trends, SLA timers, and more. Teams can create dashboards tailored to their function: one for engineering, another for IT support, another for leadership.
Jira also includes a wallboard mode, which takes any dashboard and renders it full-screen in a browser. You can set wallboards to rotate through multiple dashboards automatically. This is the native path for putting Jira onto a TV screen—but it comes with real constraints once you move beyond a single screen.
Why Real-Time Jira Dashboards on TVs Matter for Teams
When Jira data is visible all day, team behavior changes in concrete ways:
- Engineers spot blocked tickets earlier and escalate without waiting for a standup
- Support agents monitor SLA countdowns and prioritize workload before breaches occur
- Product managers can see sprint health at a glance when walking past a screen, not just in a scheduled review
- Leadership gets a continuous read on project status without pulling reports
For hybrid teams, the impact is even more significant. Remote teammates often lack the ambient context that in-office colleagues absorb just by being in the room. When the same Jira dashboards that appear on office TVs are also accessible on browser players, everyone operates from a shared view.
Common Ways Teams Try to Display Jira on TVs, and Where Each Falls Short
Most teams start with one of three approaches before realizing they need something more structured.
Direct PC-to-TV with Jira Wallboard Mode
This is the simplest path: connect a computer to a TV via HDMI, open Jira in wallboard mode, and leave it running. It works for a single screen in a single location. The problems start when you scale.
Every TV needs its own logged-in computer. Browser sessions expire. Someone updates a password, and suddenly half your TVs are showing a login screen. There is no central way to update what is displayed across multiple screens. Security is also a concern: leaving Jira open on an unattended machine with real credentials is an exposure risk.
DIY Casting and Kiosk Setups
Some teams use Chromecast, Raspberry Pi, or kiosk browsers to push Jira wallboards to screens. These approaches work as proof-of-concepts and cost little to start. But they are fragile. Sessions time out. Devices crash without alerting anyone. Credentials end up stored on random hardware across the office. When something breaks in a satellite location, someone has to physically touch the device to fix it.
Basic Digital Signage Add-Ons
Several digital signage platforms offer Jira widgets or the ability to display a Jira URL as a screen asset. These are better than DIY setups but often treat Jira as just another web page to embed, rather than a live data integration with refresh control, playlist management, and multi-location oversight.
The result is a setup that displays Jira on a TV but does not give operations teams the control they need to manage that content reliably across departments and offices.
The Shift: From Mirroring a Dashboard to Building a Visibility Layer
The goal is not to get a Jira URL onto a screen. The goal is to build a reliable, secure, and manageable layer that makes your operational data visible to every team, in every location, at all times.
That distinction changes what tool you need. You need something that can:
- Connect to Jira with secure, managed authentication
- Pull live data that refreshes automatically
- Mix Jira content with data from other tools on the same screen
- Be managed centrally for all screens across locations
- Schedule and rotate content without manual intervention
This is exactly where a dedicated digital signage and data visibility platform fits.
How RocketScreens Handles Jira on Office TVs
RocketScreens is a cloud-based platform that connects to 100+ business tools and pushes live dashboards to TV screens, browser players, and digital displays across any number of locations.
For Jira specifically, RocketScreens supports two integration paths:
- Jira Issues Integration: Connect Jira directly to RocketScreens using OAuth, with read-only permissions that keep your data secure. Display issue lists, sprint progress, open tickets, and project dashboards on any screen.
- Screenful Integration: Screenful builds visual sprint and project dashboards from Jira data—burndown charts, cycle time, cumulative flow. Connect Screenful to RocketScreens to push those dashboards to your TVs with automatic refresh.
Dashboards update in real time. You do not need to reload anything manually or maintain browser sessions on individual devices. RocketScreens handles refresh intervals through its cloud infrastructure.
Step-by-Step: Display Jira Dashboards on TV with RocketScreens
Step 1 — Connect Jira to RocketScreens
Inside RocketScreens, navigate to the Jira Issues app and authorize the connection using OAuth. Set permissions to read-only as a best practice—this ensures RocketScreens can pull Jira data without write access to your projects. If your team uses Screenful, connect Screenful to Jira first, then connect Screenful to RocketScreens as a separate data source.
Step 2 — Build a Channel for Your Team or Function
A channel in RocketScreens is a scheduled sequence of content assigned to one or more screens. Create a channel focused on a specific team—for example, "Engineering Sprint Board" or "IT Support Queue." Add slides that pull from Jira: issue views, sprint dashboards, Screenful burndown charts, or SLA trackers. Set durations so each view stays visible long enough to be read and absorbed.
Step 3 — Design the Screen Layout
Choose a layout based on what the team needs to see. A full-screen Jira dashboard works well for war-room monitoring or NOC-style setups. A split layout—Jira taking 70% of the screen with Datadog alerts or a calendar in the remaining space—works well for engineering pods that need operational context alongside project data.
Step 4 — Register Your TVs and Assign Channels
Install the RocketScreens player on each TV device, or use a browser player for screens already connected to a computer. Register each screen in the RocketScreens CMS and group them by office, floor, or team. Assign channels to screens or groups. When you update a channel, every screen showing that channel updates immediately—no on-site changes required.
Step 5 — Go Live, Gather Feedback, and Refine
Push your first Jira TV dashboard live and observe how the team responds. Adjust which metrics are shown, how long each slide displays, and where screens are placed based on actual use. RocketScreens provides remote management and analytics so you can make those changes from a single dashboard, not by touching each device.
What to Actually Show on Your Jira TV Dashboards
The metrics you display depend on who is in the room. Here is a practical breakdown by team type:
Engineering and Product Teams
- Sprint burndown chart
- Work in progress by board column
- Blocked issues count with owner visibility
- Bug backlog trend
- Release readiness indicator
- Cycle time and lead time from Screenful
Support and ITSM Teams
- Open ticket queue by priority
- SLA countdown timers by ticket
- First-response and resolution time averages
- Incident volume by category
- CSAT scores where available
Leadership and Operations
- Project health indicators across active initiatives
- Velocity and throughput trends
- Incident volume over time
- Rotated views that include Jira alongside BI dashboards, Salesforce pipeline, or financial KPIs
Real Scenarios Where Jira TV Dashboards Change How Teams Work
Support pod with live SLA visibility: A six-person support team displays a Jira queue by priority and SLA timer on a shared TV. Agents can see at a glance which tickets are approaching breach and shift focus without a supervisor intervening. The team cuts SLA violations by acting on real-time data rather than waiting for an escalation email.
Engineering squad with sprint and blocker visibility: A product squad runs a Screenful sprint dashboard on the TV near their desks. A "blocked issues" count is always visible. The team naturally unblocks faster because the metric is in front of them throughout the day, not just during standups.
NOC or operations center with multi-tool visibility: An infrastructure team displays Jira incident tickets alongside Datadog monitoring graphs on a RocketScreens channel. When a Datadog alert fires, the associated Jira incident is already visible on the adjacent panel. Response coordination happens faster because both views are on the same wall.
Leadership zone with rotated operational context: A shared leadership area rotates Jira project health, Power BI financials, and company announcements through a single screen. Executives walk past and have a continuous read on delivery status without scheduling a report review.
Common Mistakes to Avoid
- Displaying too many metrics at once: A screen packed with gadgets is hard to read from across a room. Prioritise three to five high-signal metrics per view.
- Using shared Jira credentials on unmanaged devices: This is a security risk. Use OAuth-based integrations with read-only permissions and manage authentication centrally.
- Skipping team feedback: The first dashboard you build may not be the right one. Get input from the people who will look at the screen all day.
- Treating Jira in isolation: The teams that get the most value from TV dashboards combine Jira with other tools, such as Datadog, Salesforce, and Google Sheets, so the screen tells a complete operational story.
- Ignoring remote teammates: If your setup only works for people physically in the office, you have built a partial solution. Use browser players to extend the same channels to remote team members.
Frequently Asked Questions
Can I display a Jira dashboard on a TV without extra software?
Yes. Jira's wallboard mode lets you show a dashboard full screen on any TV connected to a computer. This works for a single screen but becomes difficult to manage, secure, and scale across multiple screens and locations.
How is RocketScreens different from Jira wallboard mode?
Jira wallboards require a logged-in browser session on each device. RocketScreens manages authentication centrally, refreshes data automatically, supports content rotation across multiple Jira and non-Jira dashboards, and lets you manage all screens from a single platform without touching each device.
Is it safe to show Jira data on office TVs?
Displaying Jira by leaving a browser session open on an unattended machine is a security risk. RocketScreens connects to Jira through OAuth with read-only permissions, and all access is managed centrally. No Jira credentials are stored on individual TV devices.
Can I mix Jira with other tools on the same screen?
Yes. RocketScreens channels can combine Jira issues, Screenful sprint dashboards, Datadog monitoring graphs, Salesforce pipeline data, Power BI reports, and more on a single screen or in a rotation. This gives teams a complete operational picture without switching between tools.
Will Jira dashboards on my TVs update automatically?
RocketScreens pulls live data from connected integrations and refreshes displays automatically. You do not need to manually reload anything or maintain active browser sessions to keep the data current.
Start Displaying Jira Dashboards on Your Office TVs
Jira holds the operational data your teams need to make good decisions every day. The gap is visibility—most of that data stays behind a login screen, accessed only when someone thinks to open it.
Putting Jira dashboards on office TVs through RocketScreens closes that gap. Your sprint progress, ticket queues, SLA timers, and incident data become part of the environment your team works in, visible, current, and actionable without requiring anyone to open a browser tab.
RocketScreens connects to Jira and 100+ other business tools, centrally manages all your screens, and automatically refreshes dashboards across every location.
Book a demo with the RocketScreens team to see how Jira and your other tools can run live on every screen in your office.


