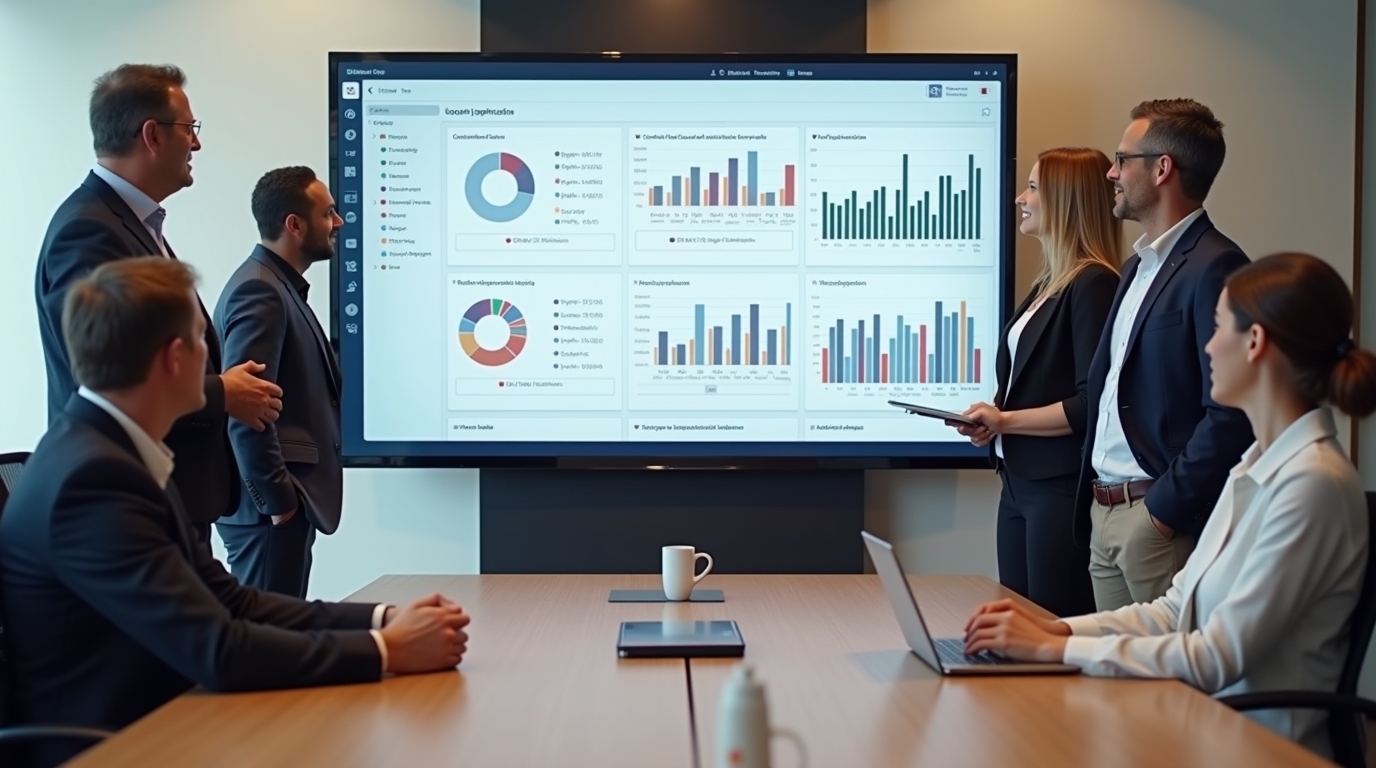
Digital dashboards on office screens keep teams focused on the same targets. Studies show employees working with visible metrics tend to perform better. For example, organizations using digital signage for internal communication saw about a 25% boost in productivity. Another survey found 86% of respondents reported higher engagement when key performance data was displayed on workplace screens. When everyone can see up-to-date Tableau charts and goals, team alignment and accountability improve.
In fact, one case study noted a 22% jump in employee engagement after introducing real-time dashboards.
This shared visibility turns raw data into action. Teams can spot trends or gaps in real time and course-correct quickly. RocketScreens, for instance, makes it easy to display live Tableau dashboards on any screen. By keeping your dashboards in sync and centrally managed, RocketScreens helps drive the productivity gains that visible data displays promise.
Checklist: Hardware, Software, and Network Requirements
Getting a Tableau dashboard on your screens requires a few key items:
- Screen: Any modern TV or monitor with an HDMI port will work. For example, Google TV or Amazon Fire TV devices (like Chromecast or Fire Stick) plug into any HDMI-enabled display to turn it into digital signage. You don't need an expensive new display - even a standard HDTV or computer monitor can be repurposed if it has HDMI.
- Player Device: A small media player or computer to run RocketScreens. Common choices include Android-based devices (Amazon Fire TV Stick 4K, Chromecast with Google TV, Android TV boxes, etc.)7. Alternatively, you can use a PC or laptop that's connected to the screen via HDMI, or even a Smart TV's web browser. RocketScreens supports three player types - physical (Android/Fire Stick), desktop (Windows/Mac app), or WebTV (a secure URL you open in any browser).
- RocketScreens Software: Install the RocketScreens app on your chosen player. On Android-based hardware (or Fire TV/Google TV), download the free RocketScreens app from the Google Play or Amazon store11. On a PC/Mac, install the RocketScreens desktop application. If using the web player, sign in to your RocketScreens account and copy the provided embed URL (no app needed).
- RocketScreens Account: A live RocketScreens subscription and login. You'll use the RocketScreens content management system (CMS) to add integrations and channels. The cloud-based dashboard lets you manage what content each screen shows.
- Tableau Account: An active Tableau Online or Tableau Server account (with at least Viewer permissions). You will generate a Personal Access Token (PAT) from Tableau to link RocketScreens to your dashboards.
- Integration Token: In your Tableau account settings, create a new Personal Access Token (give it a name like "RocketScreens") and copy the secret token value. You'll enter this name/secret into RocketScreens to authenticate.
- Integration Details: Know your Tableau domain and site name (if using Tableau Online). You'll need these exact values when setting up the integration in RocketScreens.
- Network: A reliable internet connection (Ethernet or Wi-Fi) for your player. The device must reach both the RocketScreens servers and Tableau's API. A wired connection is ideal for stability; if using Wi-Fi, ensure a strong, uninterrupted signal.
- Miscellaneous: Basic accessories like HDMI cables, power cords, and mounts or stands for the display. Make sure the player device is powered and fixed so it can run 24/7 if needed.
With these components ready, you're set to link Tableau with RocketScreens in minutes. In fact, RocketScreens highlights that setup typically takes under 5 minutes with no coding required.
How to Connect Tableau to RocketScreens (Step-by-Step)
Follow these four steps to display your Tableau workbook on screens securely:
- Generate a Tableau Personal Access Token (PAT). Log in to Tableau Online or Server, go to your user profile, and select My Account Settings. Under "Personal Access Tokens," create a new token (name it something like "RocketScreens"). You'll be shown the Token Name and Token Secret - copy the secret now and save it safely (you won't see it again).
- Enter the PAT into RocketScreens. In the RocketScreens CMS, navigate to the Integrations section and click Add Integration. Choose Tableau and click Integrate. In the dialog, fill in:
- Name: any label (e.g. "Tableau-SalesDash").
- Tableau Domain: your Tableau Server domain or the full .online.tableau.com URL (without "https://").
- Site Name: if using Tableau Online and your URL has a site, enter that (e.g. for URL https:// [instance]/#/site/sitename, use sitename).
- PAT Name: enter the token name you created.
- PAT Secret: paste the token secret you saved. Then click Create.
RocketScreens now has secure API access to your Tableau environment.
- Create a Tableau App in RocketScreens. In RocketScreens, go to the Apps tab and click New App. Search for "Tableau" and select Tableau Server. Give your app a descriptive name (for example, the workbook's title). Choose the Tableau integration you just set up, then pick your desired workbook from the dropdown list. Next, decide how long each sheet (tab) should display on screen (for example, 30 seconds per page) and whether to show a QR code or timestamp. Save the app. You can click the Preview icon in RocketScreens to see exactly how it will look on a display.
- Publish to Screens. Now that you have a Tableau app, put it into a Channel (RocketScreens' playlist system). Create or select a channel and add the Tableau app slide to it. Then go to the Players section and assign that channel to the target display(s) (your devices). Finally, publish or apply the changes. RocketScreens will immediately push the channel to each player, causing them to start showing the Tableau views in a loop.
RocketScreens makes it easy to display any Tableau workbook on any connected screen, updating them live. The above steps let your chosen Tableau dashboard cycle through on the TV. For example, a sales dashboard with live charts will refresh automatically as new data arrives, thanks to RocketScreens' real-time sync. You can always adjust the selection of sheets or the timing later through the RocketScreens dashboard.
Performance Tuning and Refresh Rates
Once the dashboard is playing, tune the display for the best experience:
- Set appropriate refresh rates. Decide how often you want new data. For rapidly changing metrics (like live sales or ticket queues), refreshing every 1-2 minutes might be needed. For slower indicators (news, KPIs, infrequently changing dashboards), you can refresh less often (hourly or daily). For example, one guide notes a 2-minute refresh is typical for a live sales board, whereas a company news page might only need updating every hour. Don't refresh so frequently that it becomes distracting or burdens the network; nor too slowly that data grows stale.
- Clip and crop content if needed. When showing a Tableau workbook, you might only care about one chart or scoreboard, not the whole Tableau UI. Use RocketScreens' content clipping feature (if applicable) to crop to the relevant region. That way, you display only the chart or data area you want, without menus or ads. This ensures viewers see exactly what matters.
- Avoid complex or dynamic elements. Web pages or dashboards with auto-play videos, pop-ups, or hover-only content won't display well on a passive screen. Make sure the sheets you show are designed for viewing (charts, graphs, tables). If something doesn't appear correctly, adjust the workbook to use static images or simpler interactions.
- Optimize the display. Use legible fonts and high-contrast color schemes in your dashboards so they're readable from a distance. Match the screen resolution to your content (1080p is usually enough). If your player device supports it, enable hardware acceleration for smoother rendering.
- Check system performance. If updates seem slow, verify that the player has a stable network. Consider using wired Ethernet rather than Wi-Fi for heavy data use. Ensure you are not running unnecessary apps on the player that could slow it down. If a screen freezes, restarting the player or the RocketScreens app often resolves it.
- Monitor via RocketScreens. The RocketScreens CMS shows when each player last checked in and what it's displaying. Regularly check that the screens are online and showing the intended channel. RocketScreens can also send notifications if a player goes offline, so you can fix issues quickly.
By finding the right balance of refresh timing and content design, you can keep screens running smoothly and displaying fresh, relevant data around the clock.
Troubleshooting Tips and Measuring ROI
Common issues & fixes:
- Blank screen or wrong content: Verify the player device is powered on and signed into the RocketScreens app or URL. In the RocketScreens dashboard, make sure the channel is assigned to the correct player. Sometimes reloading the player or using a different HDMI port can help.
- Tableau errors: If the dashboard isn't loading, re-check your Tableau PAT and domain in the integration settings. Make sure the token wasn't accidentally revoked. Also confirm you have access rights to the workbook and that you selected the correct workbook/sheet in the app.
- Slow updates: Check your network bandwidth. A busy Wi-Fi or firewall may delay content. If needed, move the player closer to the router or switch to Ethernet. Reduce screen resolution or simplify the Tableau visuals if the device has trouble rendering.
- Authentication problems: Never use "saved password" in the browser on a screen. If login fails, regenerate the Tableau PAT and update the RocketScreens integration. Ensure time and date on the player device are correct (time drift can break secure token validation).
- Contact support: If things still aren't working, the RocketScreens knowledge base and support team can guide you. Common solutions (like re-registering a player or re-building the channel) are documented in their FAQs.
Measuring ROI:
To evaluate success, compare key metrics from before and after deploying your dashboard. For example, if you use the screen to track sales goals, look at sales growth or goal attainment rates. If it's for internal KPIs, measure changes in productivity metrics (like job completion time or quality). Employee surveys can also reveal improvements in engagement or awareness.
Studies back up the impact: companies using digital signage for internal communication have seen about 25% higher productivity. Retailers report average sales lifts (some as much as 33%) when dynamic content is shown. Monitor your chosen KPIs over weeks and months. A simple ROI formula is:
ROI
(Value of improvements - Cost of solution) / Cost of solution
Include hardware and RocketScreens subscription in your cost. For gains, sum up tangible benefits (e.g. extra revenue, time saved) that you can attribute to the screens.
Even intangible gains count: 56% of communication teams are increasing digital signage because it clearly boosts engagement. Employees who see recognition and goals daily often feel more motivated. One study noted up to a 22% jump in engagement from such visible data displays.
Keep tracking: RocketScreens also provides analytics on screen usage (uptime, play counts, etc.). Use that data to refine content. Over time, as your team responds to the dashboards, you should see steady performance improvements - the real payoff of making data visible.


