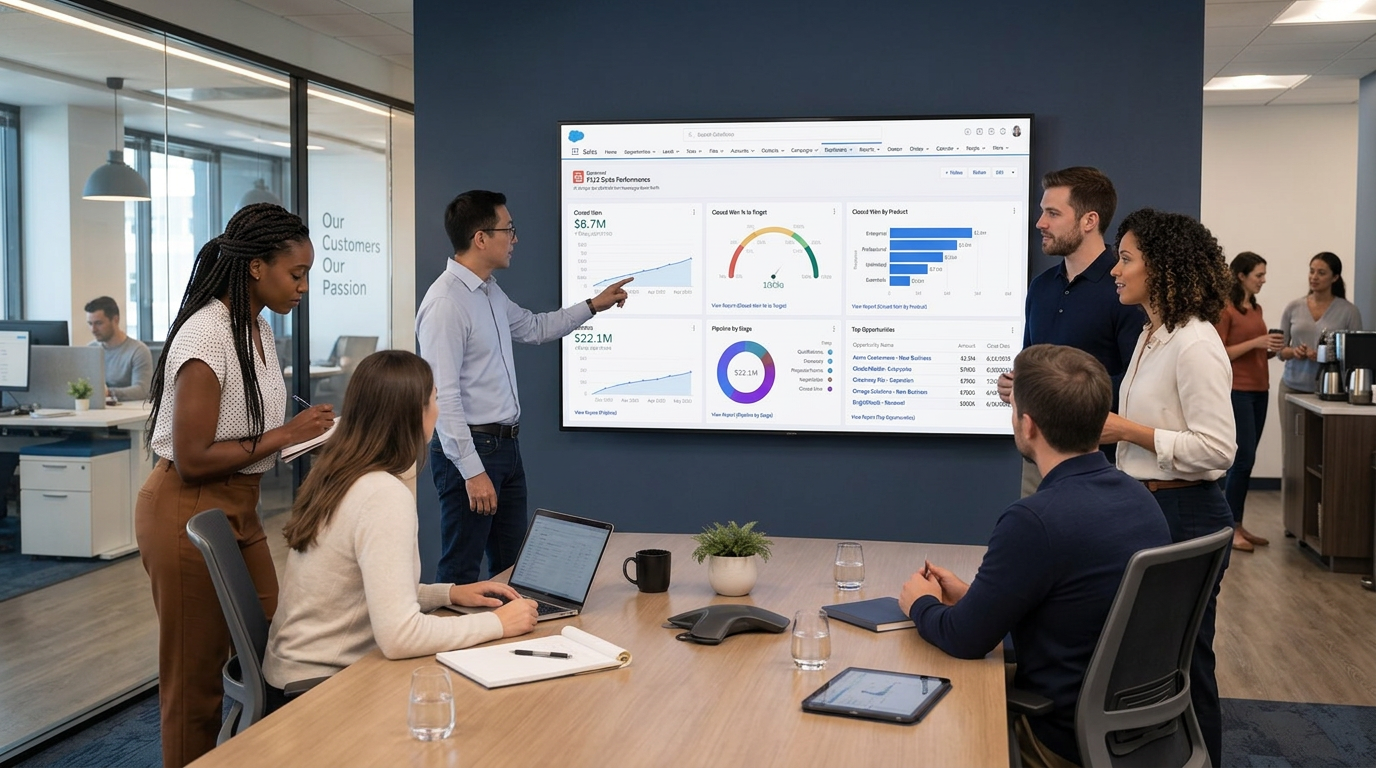
Most sales organizations already have the numbers. Pipeline coverage, quota attainment, opportunity age, win rate and activity volume all sit inside Salesforce, updated by the hour. The problem is not data collection. The problem is that the data stays locked inside individual logins, weekly exports and dashboards nobody opens between Monday standups. Displaying Salesforce KPIs on screens across your sales floor closes that gap by making performance a shared, continuous view rather than a report that arrives after the outcome is already decided.
This guide covers what a sales floor KPI display actually does, which metrics belong on the wall, how to implement it without creating a reporting burden, and where teams commonly get it wrong.
What Displaying Salesforce KPIs on the Sales Floor Actually Means
A sales floor display is a screen, or a set of screens, connected to a digital signage platform that pulls live data from Salesforce and renders it as a visual dashboard. The content refreshes automatically on a schedule you define, without anyone logging in, exporting a report or dragging a chart into a slide.
The setup is different from simply casting a Salesforce dashboard to a TV. A casted dashboard depends on a browser session, an active login and a machine that stays awake. It breaks quietly and stays broken. A signage-driven display runs as a managed endpoint with scheduling, remote monitoring and centralized control across every screen in every office.
The distinction matters at scale. One screen in one room can be handled manually. Forty screens across six offices cannot.
Why Sales Floor Visibility Changes Behaviour
Sales performance responds to feedback speed. A rep who learns on the last day of the month that they are twenty percent short has no room to act. A rep who sees the same gap on day nine has three weeks of working days to close it.
Shared visibility also does something a private dashboard cannot. It creates a common reference point. When the whole floor is looking at the same pipeline number, conversations stop being about whose spreadsheet is right and start being about what to do next. Managers spend less time reconciling figures and more time coaching.
There is a cultural effect as well. Recognition that happens publicly and automatically carries more weight than recognition that arrives in a monthly email. Seeing a name appear on a screen for a closed deal is immediate, visible to peers, and requires no manager to remember to send anything.
The Business and Operational Impact
Sales leaders evaluating this usually want to know what changes operationally. The effects tend to show up in four places.
- Faster course correction. Gaps in pipeline coverage or activity volume surface while there is still time in the quarter to respond.
- Less manual reporting. Sales operations teams stop rebuilding the same weekly deck. The screen is the report and it updates itself.
- Clearer accountability. When quota progress and activity metrics are visible, conversations about performance are grounded in the same numbers everyone has already seen.
- Better onboarding. New hires absorb what good looks like by watching the floor metrics rather than reading a document about them.
There is also a quieter benefit around data hygiene. When Salesforce data drives a public display, reps notice when their own opportunities show stale close dates or missing amounts. CRM discipline improves because inaccuracy becomes visible rather than buried.
Which Salesforce KPIs Belong on a Sales Floor Screen
Not every field in Salesforce deserves wall space. A screen has a few seconds of attention at a time, so the selection has to be deliberate.
Revenue and Quota KPIs
- Closed won revenue against target, by month or quarter
- Quota attainment by rep and by team
- Forecast category totals such as commit and best case
- Average deal size and its trend
Pipeline Health KPIs
- Pipeline coverage ratio against quota
- New pipeline created this period
- Opportunities by stage, with stage ageing
- Win rate and loss reasons over a rolling window
Activity and Productivity KPIs
- Calls, meetings booked and demos completed
- Lead response time from inbound submission to first touch
- Follow-up tasks overdue
- SDR to AE handoff volume
Recognition and Team KPIs
- Leaderboards by revenue, activity or improvement
- Deal alerts when an opportunity moves to closed won
- Team milestones and streaks
- Named callouts for first deals, largest deal or fastest cycle
A practical rule is one screen, one job. A revenue screen near the leadership area, an activity and response time screen near the SDR pod, and a recognition screen in the shared space works better than a single dense dashboard that tries to serve everyone.
How to Implement Salesforce KPI Displays
Step 1: Define the decisions the screen supports
Start from the action, not the metric. If nobody would behave differently based on a number, it does not belong on the wall. Write down the two or three decisions each screen is meant to influence and select KPIs that map to them.
Step 2: Confirm the Salesforce data is trustworthy
Agree on definitions before anything goes live. What counts as a qualified opportunity, when a stage advances, how partial-quarter quota is prorated. A public screen amplifies whatever inconsistency already exists in your CRM, so resolve it first.
Step 3: Connect Salesforce to your signage platform
Use a platform that supports a direct Salesforce integration rather than screenshots or manual uploads. RocketScreens connects through its integration library, which spans more than 100 business systems, so Salesforce reports and dashboards can be pulled into scheduled screen content and refreshed on a set interval without a person in the loop.
Step 4: Design for distance and glance time
Sales floor screens are read from ten to thirty feet away while people are walking, talking or on calls. Use large type, high contrast, a small number of data points per view, and rotate between views rather than compressing everything into one layout.
Step 5: Set access, scheduling and governance
Decide who can change what appears, and when. Cloud-based centralized management lets a small operations team control screens across multiple offices from one interface, apply different content by location, and schedule quiet periods such as client visits or interview days.
Step 6: Pilot, then expand
Run one floor or one team for four to six weeks. Ask reps and managers what they actually look at. Cut what nobody uses. Then scale to other locations with a proven layout instead of rolling out an untested design across the estate.
Industry Use Cases
Technology and SaaS. Inside sales teams track pipeline created, demo volume and trial to paid conversion. Screens near SDR pods focus on lead response time, which is often the single metric with the tightest link to conversion.
Financial services and insurance. Branch and advisory teams display policy or product volumes, renewal pipeline and client review completion. Compliance-sensitive environments typically show aggregated team figures rather than individual client detail.
Manufacturing and distribution. Sales floors display quote to order conversion, backlog value and account coverage, often alongside operational metrics from other connected systems on the same screen network.
Real estate and property. Teams show listings under contract, viewings booked and pipeline by agent, with recognition content for new instructions and completions.
Staffing and professional services. Screens track placements, submissions to interview ratios and open requisitions by consultant.
Common Challenges
Metric overload. The most frequent failure is putting eighteen numbers on one screen. People stop reading it within a week. Restrict each view to three to five figures.
Data disputes. If two teams calculate win rate differently, the screen becomes a source of argument. Lock definitions in advance and document them.
Perceived surveillance. Activity metrics displayed without context can feel punitive. Frame the display around team progress and pair individual metrics with improvement and effort measures, not only outcomes.
Screens that go stale. A display showing last week's figures damages credibility faster than no display at all. Choose a platform with device health monitoring so a frozen or offline screen is flagged and fixed rather than ignored.
Multi-location inconsistency. Different offices building their own layouts creates confusion when teams compare numbers. Centralized template management prevents this.
Best Practices for Displaying Salesforce KPIs
- Show a target alongside every performance number so the figure has meaning at a glance
- Include a time context such as day nine of twenty two working days
- Rotate between three or four views on a fifteen to thirty second cycle
- Mix outcome metrics with leading indicators, since leading indicators are the ones reps can act on today
- Use consistent colour logic across all screens for on target, at risk and behind
- Reserve a portion of screen time for recognition rather than filling every slot with numbers
- Review the KPI selection quarterly and retire metrics that no longer drive decisions
- Keep sensitive commercial detail such as named client discounting off public displays
Mistakes to Avoid
- Treating the screen as a replacement for coaching conversations rather than an input to them
- Displaying only bottom-of-funnel revenue, which leaves early-quarter screens looking empty and demotivating
- Ranking every rep publicly at all times, which tends to discourage the middle of the distribution
- Building layouts in a design tool and updating them manually, which guarantees the content will drift out of date
- Ignoring screen placement, since a display outside sightlines is a display nobody sees
- Rolling out to every location before validating the content with one team
Measuring Whether It Is Working
Set a baseline before launch on a small number of measures: average lead response time, pipeline created per rep per week, forecast accuracy against actual, and hours spent by sales operations on recurring reporting. Compare after ninety days.
Qualitative signals matter too. Ask managers whether pipeline reviews start faster because everyone already knows the numbers. Ask reps whether they check the screen without being prompted. Sustained voluntary attention is the clearest indication that the content is useful.
Frequently Asked Questions
How often should Salesforce KPI screens refresh?
Most sales floors run a refresh between five and thirty minutes. Deal alerts and activity counters benefit from shorter intervals, while quota and forecast views are usually fine at hourly or daily cadence. Very frequent refreshes on slow-moving metrics add API load without adding value.
Do we need a Salesforce administrator to maintain this?
An administrator is normally involved at setup to configure reports, fields and access permissions. Ongoing operation does not require admin involvement when the signage platform handles scheduling and refresh automatically. Changes are needed only when KPI definitions or report structures change.
Is it safe to display CRM data on public screens?
It depends on placement and content. Screens in areas visitors can access should show aggregated team performance rather than named accounts, deal values or client detail. Use location-specific content rules so internal floors and public-facing areas display different views from the same system.
Can we combine Salesforce data with other business systems on the same screen?
Yes. A signage platform with a broad integration library can render Salesforce alongside data from support, marketing, finance or operations tools, which gives commercial teams a fuller picture than CRM alone. Keep combined views simple, since mixing sources increases the risk of visual clutter.
How many screens does a sales floor need?
Start with one screen per team sightline. A floor of thirty reps in an open plan space is usually well served by two to three screens with different content focus. Adding screens beyond the point of visibility adds cost without improving attention.
Bring Your Salesforce Data Onto the Floor
Sales performance data loses value the longer it sits between the system and the people who can act on it. Putting Salesforce KPIs on managed screens across your sales floor removes that delay, reduces recurring reporting work and gives every team the same live view of where the quarter stands.
RocketScreens provides secure cloud-based digital signage with centralized management, real-time dashboards, more than 100 integrations including Salesforce, and enterprise-grade reliability across multi-location deployments.
Book a demo to see live Salesforce dashboards running on RocketScreens, or speak with our team about a pilot for one sales floor before scaling across your organization.