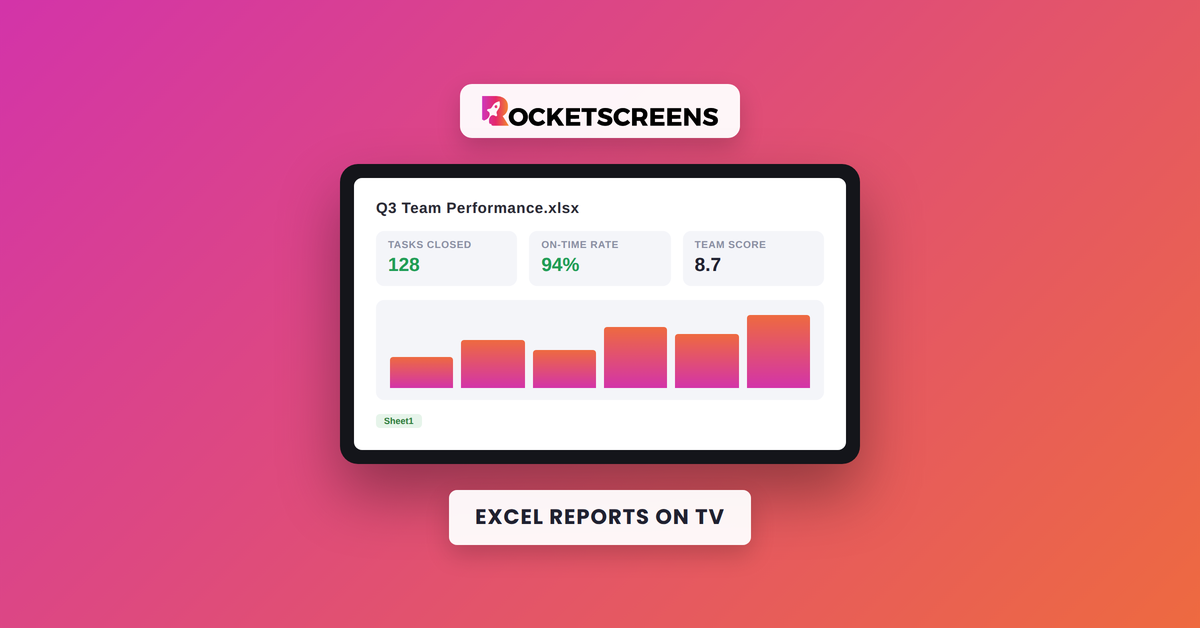
Excel reports on TV screens give teams a shared, always-visible view of the numbers that matter most. Instead of metrics sitting inside a spreadsheet on one manager's laptop, they become part of the physical workspace, visible to everyone who walks past. This shift changes how quickly teams notice problems, how often they discuss performance, and how accountable individuals feel for their numbers.
Most organizations already build strong Excel reports. Sales pipelines, production counts, support ticket volumes, and campaign metrics are tracked carefully. The gap is distribution. Reports get emailed once a week, opened briefly, then forgotten until the next cycle. Putting the same data on a TV screen closes that gap by making the report a constant presence rather than an occasional file.
What It Means to Display Excel Reports on TV
Displaying Excel reports on TV refers to showing a live or automatically refreshed spreadsheet, chart, or summary table on a television mounted in a shared space, such as an office floor, sales bullpen, warehouse, or control room.
This is different from presenting a spreadsheet during a meeting. A TV-based Excel report runs continuously, updates on a schedule, and requires no one to open a laptop or click into a file. It behaves more like a wallboard than a document.
Three components are usually involved:
- A source Excel file, either stored locally, on a shared drive, or in a cloud service such as OneDrive or SharePoint
- A refresh mechanism that pulls updated figures into the file on a set interval
- A display method that renders the file, or an image or webpage generated from it, on the screen
Why Displaying Excel Reports on TVs Matters for Organizations
Numbers that stay inside a file tend to stay inside a small circle of people. Numbers on a screen belong to the whole room. That difference has measurable effects on how teams work.
Visibility Changes Behavior
When a target is visible all day, people check it without being asked to. A support team that sees open ticket count on a screen tends to close tickets faster than one that checks a spreadsheet once a shift. The data does not change; the frequency of exposure does.
Shared Context Reduces Repeated Questions
Managers spend a surprising amount of time answering "where do we stand" questions. A TV report answers that question before it is asked, freeing up meeting time for discussing what to do about the numbers rather than reporting them.
Transparency Builds Trust
Teams that can see the same figures leadership sees tend to trust those figures more. Hidden reporting invites suspicion that numbers are being managed or selectively shared. A public screen removes that doubt.
Business and Operational Impact
The impact of displaying Excel reports on TV shows up in a few concrete areas.
Faster Response to Problems
A dip in output, a spike in returns, or a slowdown in call answer rate is noticed within minutes on a live screen rather than at the next scheduled report. Faster noticing means faster correction, before a small issue becomes a larger one.
Stronger Accountability Without Micromanagement
A visible target does the work a manager would otherwise have to do verbally. Teams tend to self-correct pace when they can see their own numbers next to a goal line, reducing the need for constant check-ins.
Better Cross-Department Awareness
Placing operational, sales, or marketing Excel reports on screens in shared areas lets adjacent teams understand how their work connects to outcomes elsewhere in the business. A warehouse team seeing order volume trends, for example, can plan staffing before a backlog forms.
Reduced Reporting Overhead
Once a report is set to refresh automatically and display continuously, staff spend less time manually compiling and distributing updates. The file does the reporting; people focus on interpreting it.
Implementation Steps
Getting from a static spreadsheet to a working TV report generally follows this sequence.
- Define the audience and location. Decide who needs to see the report and where they naturally gather, such as a sales floor, break room, or operations hub.
- Select the metrics. Limit the report to a small set of figures that matter to that specific audience. A screen crowded with every column from a working spreadsheet becomes unreadable from a distance.
- Simplify the layout. Increase font sizes, remove gridlines and unnecessary columns, and use large summary numbers or simple charts rather than dense tables.
- Set up automatic data refresh. Connect the report to its live data source, whether that is a shared workbook, a database query, or a connected business tool, so figures update without manual editing.
- Choose a display method. Options range from simply mirroring a computer screen to using a centralized digital signage platform that can schedule, rotate, and remotely manage what appears on each screen.
- Test from a distance. Stand at the far end of the room and confirm the numbers and labels are legible before rolling the screen out permanently.
- Review and adjust. Revisit the report after a few weeks. Metrics that no one references should be removed; new priorities should be added.
Industry Use Cases
The same underlying idea, live Excel data on a shared screen, applies differently across industries.
Sales Organizations
Daily and monthly quota attainment, pipeline value, and leaderboard rankings displayed on a sales floor keep reps aware of pace throughout the day rather than only at month-end reviews.
Manufacturing and Warehousing
Units produced, downtime minutes, and safety incident counts on a floor-level screen give shift teams a real-time read on output against target, supporting faster line-level decisions.
Customer Support Centers
Open ticket count, average response time, and queue length on a wall display help agents self-manage workload without a supervisor announcing it verbally.
Marketing and Growth Teams
Campaign spend, lead volume, and conversion rate summaries pulled from an Excel tracker give marketing teams a constant view of performance against monthly goals, similar to a media buying desk.
Corporate Offices and Executive Areas
Company-wide OKRs, revenue against forecast, or headcount by department shown in common areas keep broader organizational goals visible to staff outside the departments directly measuring them.
Common Challenges
Organizations that try this on their own often run into a similar set of obstacles.
- Manual refresh dependency. A report that requires someone to open and re-save the file each morning tends to go stale within a week.
- Overloaded screens. Trying to replicate a full working spreadsheet on a TV instead of a simplified summary view makes the report unreadable from normal viewing distance.
- Hardware limitations. Basic smart TVs or underpowered streaming devices can struggle to render live, refreshing data reliably over long hours.
- No central control. Without a way to manage content remotely, updating or troubleshooting a screen requires someone to physically access the device.
- Security oversight. Publicly accessible screens showing sensitive figures, such as individual pay-linked metrics, can create discomfort or compliance concerns if not planned carefully.
Best Practices
- Keep each screen focused on one audience and one purpose rather than trying to serve every department from a single display.
- Limit the number of metrics shown at once. Five to eight clear figures outperform twenty small ones.
- Use consistent formatting and color coding, such as green and red thresholds, so trends can be read at a glance.
- Automate the data refresh cycle so the report never depends on a person remembering to update it.
- Run the display on a dedicated account or device separate from an individual's personal login, since admin views often include controls not meant for public display.
- Revisit the metrics quarterly to keep the report aligned with current priorities.
Mistakes to Avoid
- Treating the TV report as a one-time setup rather than something that needs periodic review.
- Displaying raw spreadsheet views instead of a simplified, distance-readable summary.
- Showing individually identifiable performance data in a way that damages morale rather than motivating it.
- Placing the screen somewhere the intended audience rarely passes.
- Relying on consumer smart TV apps for mission-critical, always-on reporting without a backup plan for outages.
Frequently Asked Questions
Can I display a live Excel file on a TV without special software?
Yes, a spreadsheet can be mirrored from a laptop or connected through cloud file viewing, though this typically requires a dedicated device to stay connected and does not offer scheduling or remote management across multiple screens.
How often should the data on a TV report refresh?
This depends on how time-sensitive the metric is. Sales and support queues often benefit from refresh intervals of a few minutes, while broader business metrics may only need to update a few times a day.
Is it safe to display company performance data publicly in the office?
Team-level and department-level metrics are generally appropriate for shared screens. Sensitive individual data, compensation-linked figures, or confidential financial detail should be reviewed before being placed on a publicly visible display.
What size team benefits most from a TV Excel report?
Any team with a shared target benefits, from a five-person support desk to a multi-location sales organization. The value comes from shared visibility rather than team size specifically.
Can multiple locations show the same or different reports from one central Excel source?
With a centralized display and content management approach, one organization can push the same report to every location or vary it by site, department, or region from a single control point.
Turn Your Excel Reports Into a Live Team Performance Screen
RocketScreens connects directly to Excel and other data sources, keeping reports refreshed automatically and distributed across every screen your team relies on, from a single office to a multi-location operation. Centralized management, real-time dashboards, and secure cloud-based architecture make it straightforward to turn a working spreadsheet into a display your whole team checks throughout the day.
Book a demo with RocketScreens to see how your Excel reports can run live on office TVs, or explore the platform to review integration options for your existing tools.