The manufacturing floor is a complex environment. From managing intricate supply chains and monitoring equipment performance to ensuring product quality and worker safety, plant managers juggle countless variables every second. In this high-stakes setting, making decisions based on gut feelings or outdated spreadsheets is no longer a viable option. Modern manufacturing runs on data, but collecting that data is only half the battle. The real challenge lies in turning vast amounts of raw information into clear, actionable insights that can be used to drive meaningful improvements.
This is where Microsoft Power BI comes in. It's a powerful business analytics tool that helps companies of all sizes make sense of their data. For the manufacturing industry, Power BI provides a way to connect disparate data sources, monitor operations in real time, and uncover opportunities for growth and cost savings. By visualizing complex datasets, manufacturers can move from reactive problem-solving to proactive strategy.
This guide explores how Power BI is helping to shape the future of manufacturing. We will look at the common data challenges that factories face, see how Power BI addresses them, and identify the key performance indicators (KPIs) you should be tracking. Finally, we’ll show you how to bring these insights directly to your factory floor with digital signage, creating a transparent and data-driven culture.
The Data Dilemma in Modern Manufacturing
Before we explore the solutions, it's important to understand the specific data hurdles that manufacturers face daily. These are not small issues; they can lead to significant inefficiencies, increased costs, and missed opportunities.
Navigating Data Silos
A typical manufacturing facility uses multiple software systems. You might have an Enterprise Resource Planning (ERP) system for finances and inventory, a Manufacturing Execution System (MES) to track production, a Quality Management System (QMS) for compliance, and data coming directly from IoT sensors on your machinery. Each system holds a valuable piece of the puzzle, but they rarely talk to each other. This creates data silos, making it nearly impossible to get a complete picture of your operations. Answering a seemingly simple question like, "How did a specific batch of raw materials affect our production yield?" can require hours of manually pulling and combining reports.
The Absence of Real-Time Information
On the factory floor, conditions can change in an instant. A machine might malfunction, a supply shipment could be delayed, or a quality issue could arise. When decisions are based on reports that are hours or even days old, you're always playing catch-up. The lack of real-time data means that by the time you identify a problem, the damage has already been done, leading to costly downtime, wasted materials, and schedule disruptions.
Operational Complexity
Manufacturing processes are inherently complex, with numerous interdependent steps. Understanding the connections and identifying bottlenecks requires a deep analysis of data from across the production line. Without the right tools, it's difficult to see how a small change in one area might impact another. This complexity can hide inefficiencies and prevent you from making the small adjustments that lead to big improvements in output and quality.
How Power BI Clears the Path for Manufacturing Success
Power BI directly addresses these challenges by providing a unified platform to connect, analyze, and visualize your manufacturing data. It acts as a central hub, breaking down silos and giving you the clarity needed to make smarter, faster decisions.
A Single Source of Truth
Power BI's strength lies in its ability to connect to hundreds of data sources, from on-premise databases like SQL Server to cloud-based applications and simple Excel files. It can pull data from your ERP, MES, IoT sensors, and more into a single, cohesive data model. This provides a unified view of your entire operation, ensuring that everyone from the CEO to the shop floor supervisor is looking at the same information.
Real-Time Monitoring for Proactive Control
With Power BI, you can create live dashboards that automatically update as new data comes in. Imagine being able to see your production line's performance in real time on a large screen. You can set up alerts to notify you instantly if a key metric, like machine temperature or defect rate, goes outside of its normal range. This allows your team to address issues as they happen, not after the fact, minimizing downtime and maintaining quality.
Predictive Insights for Maintenance and Quality
Power BI goes beyond simply showing what happened in the past. By integrating with Azure Machine Learning, it can help you predict future outcomes. For example, you can analyze historical data from your equipment to predict when a machine is likely to fail. This allows you to schedule maintenance proactively, avoiding unexpected breakdowns. Similarly, you can analyze production data to identify the factors that lead to defects, helping you to improve your processes and reduce waste.
Fine-Tuning the Supply Chain
A smooth-running supply chain is critical for any manufacturer. Power BI helps you monitor every aspect, from supplier performance and inventory levels to shipping times. You can create dashboards to track on-time delivery rates from your vendors, identify your slowest-moving inventory to reduce carrying costs, and forecast future demand to ensure you have the right materials on hand.
Essential Manufacturing KPIs to Visualize with Power BI
To get the most out of Power BI, you need to focus on the right metrics. A well-designed dashboard should present the most critical information at a glance. Here are some of the most important KPIs for manufacturers:
Overall Equipment Effectiveness (OEE)
OEE is the gold standard for measuring manufacturing productivity. It combines three factors:
- Availability: The percentage of time your equipment is running during its scheduled production time.
- Performance: The speed at which your machines are running as a percentage of their designed speed.
- Quality: The percentage of good parts produced out of the total parts produced.
A Power BI dashboard can display your OEE score in real time, with the ability to drill down into each of the three components to identify the root cause of any losses.
Production Volume and Cycle Time
Tracking your production volume helps you understand your output and ensure you are meeting your targets. Cycle time, the average time it takes to produce one unit, is a direct measure of your efficiency. Visualizing these metrics can help you spot trends and identify opportunities to increase throughput.
Defect Rate and First Pass Yield
Quality is non-negotiable. Tracking your defect rate helps you understand how often things are going wrong. First Pass Yield, the percentage of products that are manufactured correctly to specifications without any rework, is an even better indicator of process quality. A Power BI report can highlight which production lines, shifts, or machines are experiencing the highest defect rates, allowing you to focus your improvement efforts.
On-Time Delivery
This KPI measures your ability to meet customer expectations. It’s a crucial indicator of customer satisfaction and the overall health of your production and logistics processes. A Power BI dashboard can track this metric and help you analyze the reasons for any delays, whether they originate in production, warehousing, or shipping.
Inventory Turnover
This metric shows how quickly you are selling your inventory. A high turnover rate is generally good, as it indicates strong sales and efficient inventory management. A low turnover rate might mean you are overstocking or that demand has slowed. Power BI can help you monitor inventory levels and sales data to optimize your stock.
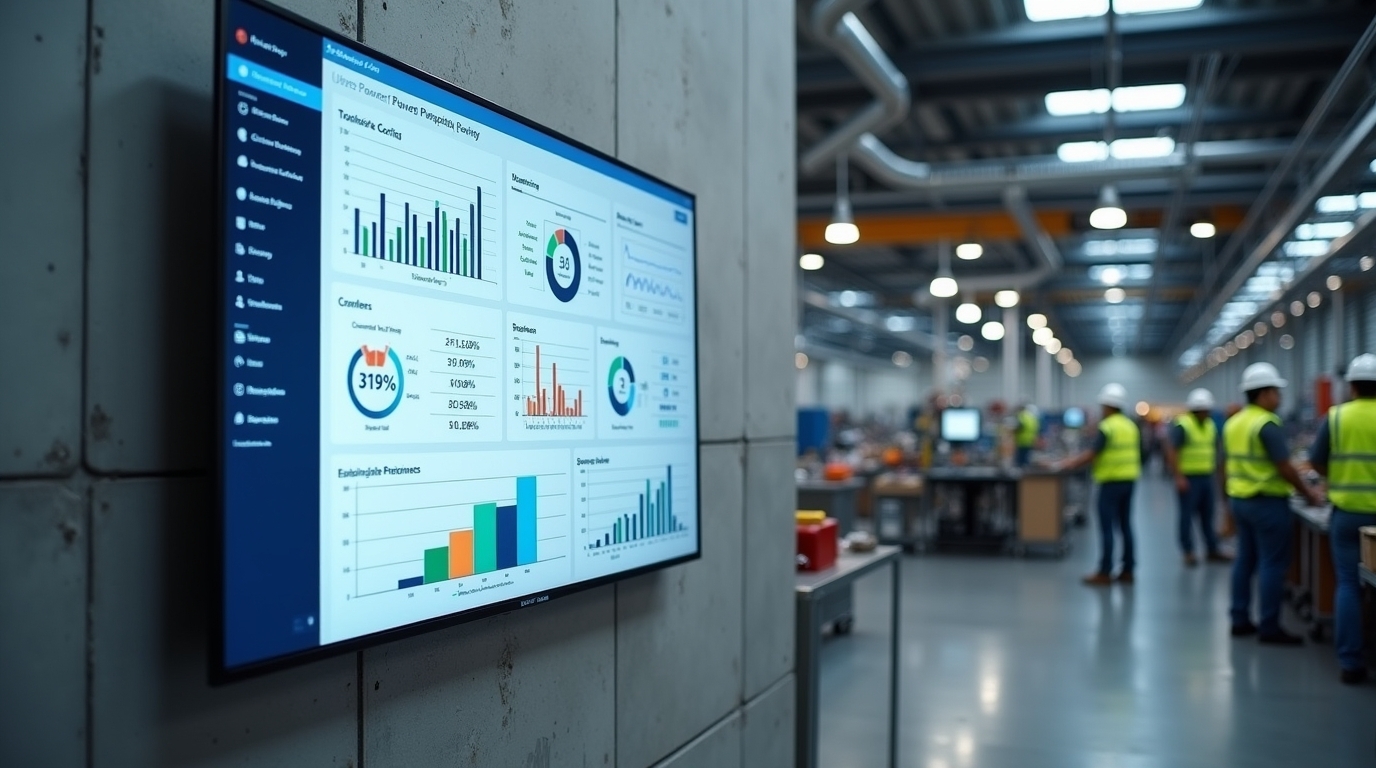
Bringing Data to Life: Power BI and Digital Signage
Creating insightful Power BI dashboards is a huge step forward. But to create a truly data-driven culture, you need to make that information visible and accessible to the people who can act on it—your team on the factory floor. This is where digital signage becomes an essential tool.
Displaying your Power BI dashboards on large screens in production areas, break rooms, and meeting spaces ensures that everyone is aware of the current performance and goals. It fosters a sense of shared ownership and empowers employees to make data-informed decisions in their day-to-day work.
RocketScreens: Your Bridge Between Power BI and the Factory Floor
While Power BI is an excellent analytics platform, sharing its dashboards securely and reliably on multiple screens requires a specialized solution. That’s where RocketScreens comes in.
RocketScreens is a simple and secure digital signage platform that makes it easy to display your Power BI reports and dashboards anywhere you need them. With our direct Power BI integration, you don't need to worry about insecure public URLs or complicated workarounds. Simply log in to your Microsoft account through our platform, and you can securely pull any of your reports and dashboards onto your digital signs.
But it doesn’t stop there. RocketScreens securely connects to over 100 other applications, allowing you to display more than just your production KPIs. You can show safety announcements from your HR system, welcome messages for visitors, company news, and more—all on the same screen. This creates a powerful communication channel that keeps your entire team informed, engaged, and aligned.
By combining the analytical power of Power BI with the communication reach of RocketScreens, you can transform your manufacturing operations. You can move beyond static reports and create a dynamic environment where data is at the heart of everything you do.
Ready to bring your data to life? Explore how RocketScreens can help you display your powerful information and foster a culture of continuous improvement.


