Your business runs on data. Sales figures, marketing analytics, operational efficiency, and customer support tickets—these are the numbers that define success. But for many organizations, this critical information stays hidden away in complex reports and spreadsheets, accessible only to a select few. What if you could liberate that data and put it where everyone can see it, act on it, and be guided by it every single day?
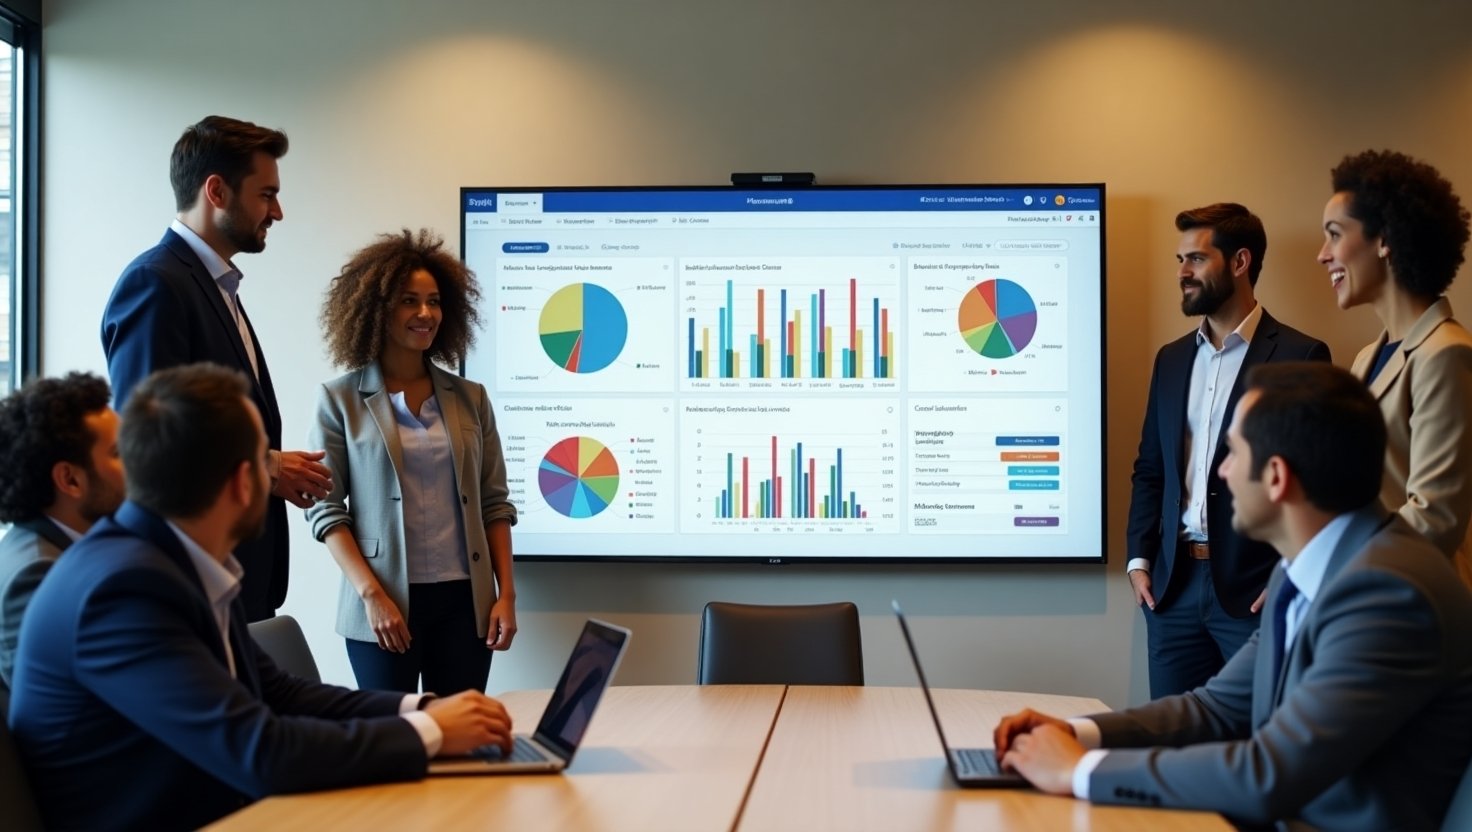
This is the core value of Power BI digital signage. By broadcasting your interactive Power BI dashboards onto screens throughout your workplace, you move data from a passive report to an active, real-time scoreboard for your entire company. This isn't just about showing pretty charts; it's about creating a transparent, accountable, and data-fluent culture.
This guide will walk you through nine practical strategies to use Power BI digital signage. We'll explore how different departments can use shared data to make smarter decisions, spot opportunities faster, and keep everyone aligned on the metrics that matter most.
Table of Contents
- What Exactly is Power BI Digital Signage?
- The Business Case: Why Display Power BI Dashboards on Screens?
- 9 Essential Strategies for Your Power BI Digital Signage
- 1. Centralize Sales KPIs for a Competitive Edge
- 2. Visualize Real-Time Manufacturing & Operations Metrics
- 3. Track Marketing Campaign Performance Instantly
- 4. Display Customer Support & Service Level Metrics
- 5. Showcase Financial Health in the C-Suite
- 6. Monitor IT & Network Performance Dashboards
- 7. Share Project Management Progress & Milestones
- 8. Boost Employee Engagement with HR Analytics
- 9. Create a Centralized Data Hub for All Departments
- Choosing the Right Digital Signage Solution for Power BI
- Get Started in Minutes with RocketScreens
What Exactly is Power BI Digital Signage?
Before we explore the strategies, let's clarify the concept. It's a simple but powerful combination of two technologies:
- Microsoft Power BI: A leading business intelligence (BI) tool that allows you to connect to various data sources, create detailed reports, and build interactive visualizations and dashboards. It turns raw data into understandable insights.
- Digital Signage: Any digital display—like a TV screen in your office, on a factory floor, or in a breakroom—used to show information.
Power BI digital signage, therefore, is the practice of securely connecting your Power BI account to a digital signage platform (like RocketScreens) to automatically display your live dashboards on screens. Instead of requiring employees to log in to view a report, the key information is broadcast for constant visibility.
The Business Case: Why Display Power BI Dashboards on Screens?
Is taking data from a desktop to a large screen truly worth the effort? Absolutely. The benefits go far beyond aesthetics and have a direct impact on performance and culture.
- Breaks Down Data Silos: When marketing can see sales data and operations can see customer support metrics, everyone gains a more holistic view of the business. This shared awareness fosters cross-departmental collaboration.
- Promotes a Data-Driven Culture: When data is visible and part of the daily environment, it becomes the foundation for conversations and decisions. Teams naturally start asking "What do the numbers say?" instead of relying on gut feelings.
- Increases Accountability and Motivation: Publicly displayed KPIs create a sense of ownership. Sales teams can see their progress toward a target, and support teams can track their response times. This visibility often sparks friendly competition and a collective drive to improve.
- Speeds Up Decision-Making: With real-time data always in view, managers and teams can spot issues or opportunities the moment they arise. A sudden dip in production or a spike in website traffic is noticed immediately, allowing for quicker responses.
9 Essential Strategies for Your Power BI Digital Signage
Here are nine proven ways to implement Power BI digital signage across your organization to achieve specific business goals.
1. Centralize Sales KPIs for a Competitive Edge
Sales is a numbers game, and visibility drives performance. Dedicate screens in the sales area to a dashboard showing real-time metrics like leads generated, calls made, deals closed, and revenue against a target. A leaderboard can ignite a team’s competitive spirit and keep everyone focused on the main goal.
- Key Metrics to Display: MTD/QTD Revenue vs. Target, Leaderboard by Rep, New Leads, Conversion Rate, Average Deal Size.
2. Visualize Real-Time Manufacturing & Operations Metrics
On a factory floor or in a warehouse, efficiency and safety are paramount. A Power BI digital signage screen can display live data from production lines, inventory systems, and quality control. This allows floor managers to spot bottlenecks, monitor equipment status, and track output against hourly or daily goals, preventing small issues from becoming big problems.
- Key Metrics to Display: Units Produced per Hour, Order Fulfillment Rate, Downtime Percentage, Inventory Levels, Safety Incidents.
3. Track Marketing Campaign Performance Instantly
Marketing teams manage multiple campaigns across various channels. A dedicated dashboard can pull data from Google Analytics, Meta Ads, Google Ads, and your CRM to provide a live snapshot of campaign health. This allows the team to see what’s working, what’s not, and pivot their strategy without waiting for a weekly report.
- Key Metrics to Display: Website Traffic, Lead Generation by Channel, Cost Per Acquisition (CPA), Ad Spend vs. Budget, Social Media Engagement.
4. Display Customer Support & Service Level Metrics
For customer-facing teams, success is measured by responsiveness and resolution. A Power BI dashboard can show live data from your ticketing system, like Zendesk or Salesforce Service Cloud. Displaying metrics like average response time, ticket volume, and customer satisfaction (CSAT) scores keeps the team focused on providing excellent service.
- Key Metrics to Display: Open Tickets, Average First Response Time, Resolution Rate, CSAT Score, Top Performing Agents.
5. Showcase Financial Health in the C-Suite
In executive suites or finance departments, high-level financial dashboards provide a constant pulse on the health of the business. A screen displaying key financial indicators helps leaders stay informed and aligned on strategic goals. This keeps the most important business metrics top-of-mind for key decision-makers.
- Key Metrics to Display: Revenue Growth, Profit Margins, Operating Expenses, Cash Flow, Customer Lifetime Value (CLV).
6. Monitor IT & Network Performance Dashboards
IT teams need to ensure the company’s digital infrastructure is running smoothly. A Power BI digital signage screen in the IT department can visualize network uptime, server status, helpdesk ticket inflow, and cybersecurity threats. This provides an at-a-glance overview, enabling the team to be proactive about system health.
- Key Metrics to Display: Network Uptime, Server CPU Load, Open Helpdesk Tickets by Priority, Security Alerts, Data Backup Status.
7. Share Project Management Progress & Milestones
For teams working on complex projects, visualizing progress is critical for staying on track. Connect Power BI to project management tools like Jira or Asana to display sprint progress, task completion rates, and upcoming deadlines. This keeps the entire team, including stakeholders, informed and aware of the project’s status.
- Key Metrics to Display: Sprint Burndown Chart, Tasks Completed vs. Remaining, Project Timeline, Budget vs. Actual Spend.
8. Boost Employee Engagement with HR Analytics
Data can also play a role in company culture. An HR-focused dashboard displayed in a common area can share non-sensitive information like new hire introductions, work anniversaries, company-wide goal progress, and survey results. This helps reinforce a sense of community and keeps employees informed about company life.
- Key Metrics to Display: Headcount Growth, Employee Anniversaries, Open Positions, Training Completion Rates, Anonymous Employee Net Promoter Score (eNPS).
9. Create a Centralized Data Hub for All Departments
Designate a screen in a high-traffic area, like a cafeteria or main hallway, to rotate through the most important dashboards from every department. A sales dashboard might show for 30 seconds, followed by marketing, then operations. This builds a shared understanding of how each part of the business contributes to the overall mission.
- Key Metrics to Display: A curated playlist of the top 1-2 KPIs from each of the departments mentioned above.
Choosing the Right Digital Signage Solution for Power BI
To make your Power BI digital signage strategy a success, you need a platform that handles the technical details so you can focus on the data. When evaluating solutions, look for these key features:
- Seamless & Secure Integration: The platform should offer a native, secure connection to your Power BI account using official APIs. Avoid solutions that require screen-sharing or unsecured logins, as they can be unreliable and pose security risks.
- Ease of Use: You shouldn't need an IT degree to get your dashboards on screen. A good system allows you to connect your account, select a report, and publish to a screen in just a few clicks.
- Hardware Compatibility: The software should be flexible, working with a wide range of common hardware, from smart TVs to dedicated media players. You shouldn't be locked into proprietary, expensive equipment.
- Content Scheduling & Management: You need more than just data. The platform should allow you to schedule when certain dashboards appear or even mix them in a playlist with company announcements, videos, and other content.
- Reliability & Support: Your screens should just work. Choose a provider known for stability and with a responsive support team ready to help if you encounter any issues.
This is where RocketScreens stands out. It was built specifically to address these needs, offering a simple, secure, and powerful way to connect Power BI and over 100 other apps to any screen.
Get Started in Minutes with RocketScreens
You’ve already done the hard work of building your dashboards in Power BI. Displaying them should be the easy part. With RocketScreens, it is.
- Connect Your Power BI Account: Securely link your Microsoft account in the RocketScreens dashboard.
- Select Your Dashboard: Browse and choose the exact report or dashboard you want to display.
- Choose Your Screens: Assign the dashboard to one screen or a group of screens anywhere in the world.
- Go Live: Your data is now visible, updating automatically to keep your team informed and aligned.
Stop letting your valuable business intelligence sit idle in reports. Put it on the walls where it can inform, motivate, and drive action. By implementing a Power BI digital signage strategy, you transform data into a shared asset that empowers your entire organization to perform at its best.
Ready to see your Power BI data in a new light? Try RocketScreens for free and bring your dashboards to life today.


