The retail landscape is more competitive than ever. To succeed, retailers need to understand their customers, streamline their operations, and make smart, data-backed decisions. This is where Power BI comes in. As a powerful business intelligence tool, Power BI helps retailers of all sizes turn raw data into actionable insights.
This comprehensive guide will explore how Power BI can be a game-changer for your retail business. We'll cover the essentials, from key features and benefits to practical use cases and integration strategies. We'll also discuss how you can take your data visualization to the next level by displaying your Power BI dashboards on digital signage.
The Challenge for Modern Retailers
Today's retailers face a multitude of challenges. Customer expectations are at an all-time high, with shoppers demanding personalized experiences and seamless omnichannel journeys. At the same time, the rise of e-commerce has intensified competition and put pressure on brick-and-mortar stores to innovate.
To navigate this complex environment, retailers need to be able to answer critical questions like:
- Who are my most valuable customers and what are their buying habits?
- Which products are performing well and which are not?
- How can I optimize my inventory to avoid stockouts and overstocking?
- Are my marketing campaigns driving sales and a positive return on investment?
- How can I improve the in-store experience to attract and retain customers?
Answering these questions requires access to accurate, timely, and easy-to-understand data. This is where Power BI proves to be an invaluable asset.
What is Power BI and How Does It Help Retailers?
Power BI is a business analytics service from Microsoft that allows you to connect to various data sources, create interactive dashboards and reports, and share insights across your organization. It provides a unified, 360-degree view of your business, empowering you to make data-driven decisions that drive growth and profitability.
For retailers, Power BI offers a wide range of benefits, including:
- Improved Customer Insights: By analyzing customer data from various touchpoints, you can gain a deeper understanding of their preferences, behaviors, and purchasing patterns. This allows you to create targeted marketing campaigns, personalize product recommendations, and deliver a superior customer experience.
- Enhanced Inventory Management: Power BI helps you optimize your inventory levels by providing real-time visibility into stock movements, sales trends, and demand forecasts. This enables you to prevent stockouts, reduce carrying costs, and improve overall supply chain efficiency.
- Better Sales Performance Analysis: With Power BI, you can track key sales metrics in real-time, such as revenue, profit margins, and conversion rates. You can also analyze sales performance by product, category, region, or even individual sales associates, allowing you to identify top performers and areas for improvement.
- Data-Driven Decision-Making: By presenting data in a clear and visually compelling way, Power BI makes it easy for everyone in your organization, from store managers to C-level executives, to understand the story behind the numbers and make informed decisions.
Key Power BI Features for the Retail Sector
Power BI comes with a host of features that are particularly beneficial for retailers:
Real-time Dashboards
Power BI's real-time dashboards provide an at-a-glance view of your most important metrics, allowing you to monitor your business performance as it happens. You can customize your dashboards to display the key performance indicators (KPIs) that matter most to your business, such as sales, inventory levels, and customer satisfaction.
Customer Insights
Power BI allows you to connect to a wide range of data sources, including your CRM system, e-commerce platform, and social media accounts, to create a unified view of your customers. You can use this data to segment your customers based on their demographics, purchase history, and engagement levels, and then tailor your marketing messages and product offerings accordingly.
Inventory Management
With Power BI, you can create detailed inventory reports that show you how much stock you have on hand, which products are selling fastest, and when you need to reorder. You can also use Power BI's forecasting capabilities to predict future demand and optimize your inventory levels to meet customer needs without overstocking.
Sales Performance Analysis
Power BI enables you to create interactive sales reports that allow you to drill down into the data and analyze sales performance from multiple angles. You can track sales by product, category, region, or even individual sales associates, and then use this information to identify top performers, spot trends, and make data-driven decisions to boost sales.
Supply Chain Management
By integrating Power BI with your supply chain management systems, you can gain end-to-end visibility into your supply chain, from sourcing and procurement to warehousing and distribution. This allows you to identify potential bottlenecks, reduce lead times, and improve overall supply chain efficiency.
Practical Applications of Power BI in Retail (Use Cases)
The applications of Power BI in the retail industry are virtually limitless. Here are just a few examples of how retailers are using Power BI to drive business success:
In-Store Analytics
By analyzing data from in-store sensors, POS systems, and customer loyalty programs, retailers can gain valuable insights into customer behavior, such as foot traffic patterns, dwell times, and product interactions. This information can be used to optimize store layouts, improve product placement, and enhance the overall in-store experience.
E-commerce Performance
For online retailers, Power BI can be used to track key e-commerce metrics, such as website traffic, conversion rates, and average order value. This data can be used to identify areas for improvement in the online customer journey, optimize marketing campaigns, and increase online sales.
Marketing Campaign Analysis
Power BI allows you to measure the effectiveness of your marketing campaigns by tracking key metrics, such as reach, engagement, and return on investment (ROI). This information can be used to optimize your marketing spend, identify the most effective marketing channels, and create more targeted and personalized campaigns.
Integrating Power BI with Your Retail Ecosystem
To get the most out of Power BI, it's important to integrate it with your existing retail systems, such as your:
- Point-of-Sale (POS) system: Integrating Power BI with your POS system allows you to analyze sales data in real-time and gain insights into customer purchasing habits.
- Customer Relationship Management (CRM) system: By connecting Power BI to your CRM system, you can create a unified view of your customers and personalize your marketing and sales efforts.
- Enterprise Resource Planning (ERP) system: Integrating Power BI with your ERP system allows you to analyze data from across your organization, from finance and accounting to supply chain and human resources.
Power BI and Digital Signage: A Powerful Combination
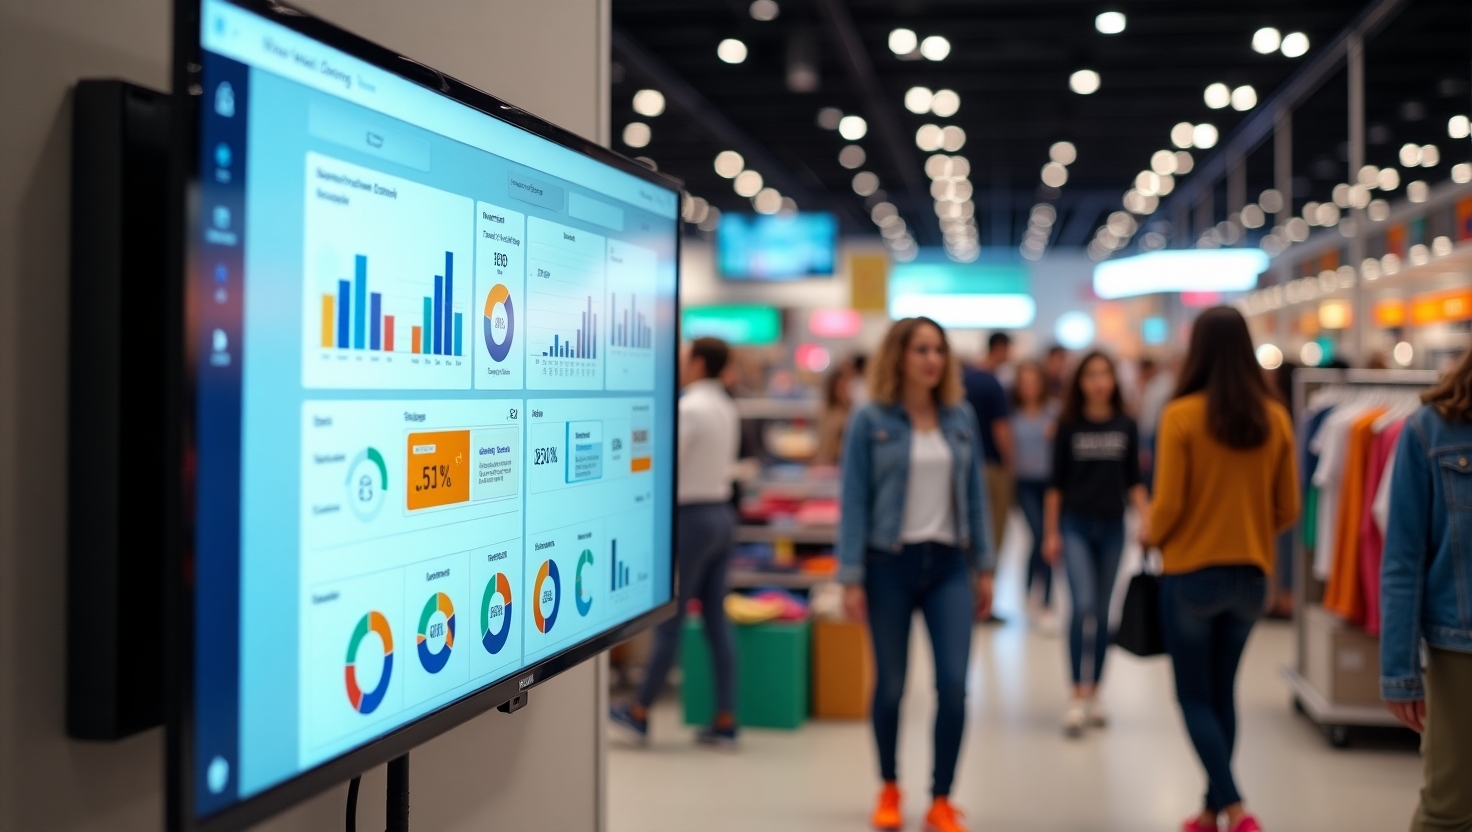
Once you have your Power BI dashboards and reports set up, you need a way to share them with your team. This is where digital signage comes in. By displaying your Power BI dashboards on digital signage screens throughout your stores, offices, and warehouses, you can ensure that everyone in your organization has access to the real-time data they need to make informed decisions.
Why Display Power BI Dashboards on Digital Signage?
- Increased Visibility: Digital signage makes your data more visible and accessible to your employees, fostering a data-driven culture and encouraging collaboration.
- Real-time Updates: With a platform like RocketScreens, your Power BI dashboards will automatically refresh on your digital signage screens, ensuring that your team always has access to the most up-to-date information.
- Improved Employee Engagement: Displaying key performance indicators (KPIs) and other important metrics on digital signage can help to motivate and engage your employees, leading to increased productivity and better business outcomes.
How RocketScreens Simplifies Power BI Integration
RocketScreens makes it easy to display your Power BI dashboards on digital signage. Our platform securely connects to your Power BI account, allowing you to display your reports and dashboards on any screen, anywhere. With our intuitive interface, you can create custom layouts, schedule content, and manage your screens from a single, centralized location.
Getting Started with Power BI for Your Retail Business
If you're ready to start leveraging the power of Power BI for your retail business, here are a few steps to get you started:
- Identify Your Business Goals: Before you start using Power BI, it's important to identify your business goals and the key questions you want to answer with your data.
- Connect Your Data Sources: Connect Power BI to your various data sources, such as your POS system, CRM, and ERP.
- Create Your Dashboards and Reports: Create interactive dashboards and reports that visualize your data in a clear and compelling way.
- Share Your Insights: Share your insights with your team by displaying your Power BI dashboards on digital signage or embedding them in your company's intranet.
The world of retail is constantly evolving, and data is the key to staying ahead of the curve. By embracing Power BI and a data-driven approach to decision-making, you can unlock new opportunities for growth, improve the customer experience, and build a more resilient and profitable retail business.


