The oil and gas sector runs on data. From the moment a drill bit breaks ground to the final transport through a pipeline, sensors and systems are generating terabytes of information. You have SCADA systems monitoring pressure, ERPs tracking costs, and safety logs recording field incidents.
Microsoft Power BI has become the standard for making sense of this noise. It organizes complex datasets into visual reports that engineers and executives can understand. However, there is a persistent gap in the industry. Building a dashboard does not guarantee anyone looks at it.
If your drilling analytics or safety reports are hidden behind a login screen or buried in a browser tab, they aren't driving decisions. They are just potential energy waiting to be used.
This guide explores how the industry uses Power BI to drive efficiency, the challenges of data adoption, and how tools like RocketScreens bridge the gap by making critical metrics visible to everyone, from the corporate boardroom to the control room.
What Power BI Means for the Oil & Gas Industry
In an industry defined by volatility and high operational costs, data interpretation is the difference between profit and loss. Power BI serves as the translation layer. It pulls raw operational data from disparate sources—drilling systems, production logs, maintenance schedules, and field operations—and turns them into actionable intelligence.
For oil and gas companies, Power BI is not just a reporting tool; it is a central hub that unifies the field with the office. It allows stakeholders to see the health of a well, the cost of extraction, and the safety status of a site in a single view.
How Power BI Works in Upstream, Midstream, and Downstream
The application of Power BI shifts depending on where you sit in the value chain:
- Upstream (Exploration & Production): Focuses heavily on reservoir performance, drilling efficiency, and well productivity. Engineers use dashboards to monitor Rate of Penetration (ROP) and minimize non-productive time (NPT).
- Midstream (Transportation & Storage): Centers on logistics. Dashboards here track pipeline pressure, fleet management, storage tank levels, and leak detection systems.
- Downstream (Refining & Marketing): Looks at refining margins, plant reliability, supply chain logistics, and retail sales performance.
Key Dashboards and Metrics Teams Use
To get value from Power BI, you need to measure the right things. Here are the core areas where analytics drive performance:
- Daily Production: Tracking barrels of oil equivalent (BOE) per day against targets.
- Drilling KPIs: Monitoring depth drilled per day, mud weight, and cost per foot.
- Equipment and Maintenance: Predicting pump failures or compressor issues before they cause downtime.
- HSE Dashboards: Visualizing "Days Since Last Incident," near-miss reporting, and compliance audits.
- Pipeline Monitoring: Real-time views on flow rates, temperature, and pressure variances.
Common Challenges Teams Face
Despite the heavy investment in analytics, many oil and gas teams struggle to get a return on that investment. The technology works, but the human workflow often breaks down.
Dashboards Not Being Checked Daily
The most common issue is simple: out of sight, out of mind. A production manager might check Power BI on Monday morning, but by Wednesday, they are buried in emails and meetings. The dashboard sits unopened, and the insights inside it go unnoticed until the end-of-month review. By then, it is too late to fix the problem.
Scattered Tools and Delayed Reports
Data lives in too many places. A field supervisor might check a SCADA HMI screen, while the finance team looks at an Excel sheet, and operations looks at Power BI. Without a unified view, these departments operate in silos. Furthermore, relying on weekly PDF summaries means leadership is making decisions based on data that is already five days old.
Slow Decision-Making
In drilling and production, speed is capital. If a pressure anomaly occurs, waiting for a scheduled report to highlight it can be disastrous. When data retrieval requires manual effort—logging in, filtering, exporting—decisions slow down.
Lack of Shared Visibility Between Teams
Field crews and office staff often feel like they work for different companies. The office sees the financial targets, but the field sees the operational reality. When these two groups don't share a view of the same KPIs, friction occurs. The office demands higher output without seeing the equipment health alerts the field crew is dealing with.
Why Visibility Is the Real Difference-Maker
Power BI is powerful, but only when the information is seen. The shift the industry needs isn't about better algorithms; it's about better visibility. This is the concept of "Ambient Intelligence"—information that is present in the environment, not hidden inside a laptop.
What Happens When KPIs Stay Hidden
When metrics are hidden, performance becomes reactive. Teams wait for a piece of equipment to break before fixing it. They wait for a budget overrun to be flagged before cutting costs. Hidden data allows for complacency because no one is constantly reminded of the goal.
How Daily Screens Improve Accountability
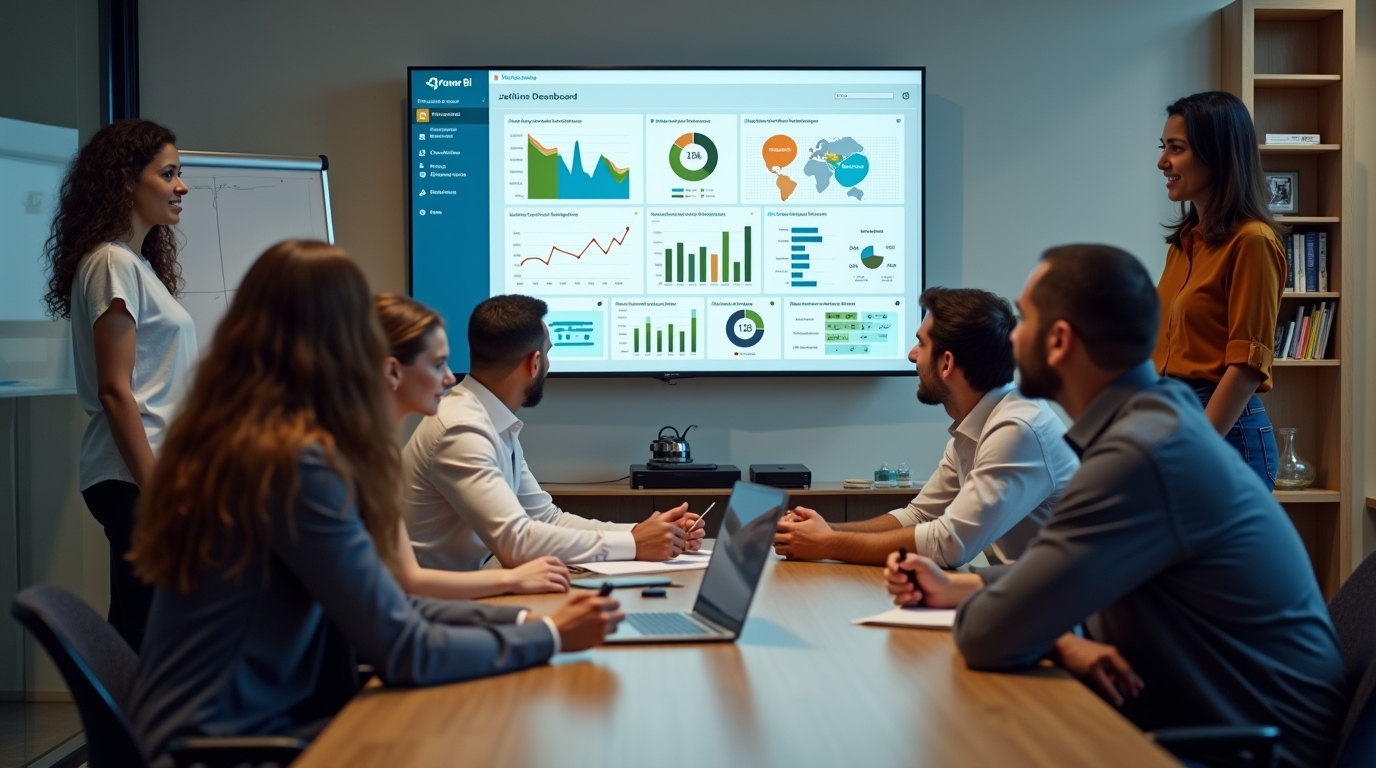
When a dashboard is displayed on a large TV in the hallway or control room, psychology kicks in. If the "Daily Production" number is in red and visible to the entire floor, the team naturally rallies to fix it. It creates a shared sense of ownership. You don't need to email the team to ask about the numbers; the numbers are right there on the wall.
Real-Time Alerts and Faster Reactions
Visibility compresses the time between an event and a reaction. If a pipeline flow rate drops significantly and that data is live on a screen in the operations center, the response is immediate. There is no waiting for a shift report.
How RocketScreens Enhances Power BI for Oil & Gas
This is where RocketScreens enters the picture. We don't replace Power BI; we amplify it. RocketScreens acts as the delivery mechanism that takes your complex Power BI analytics and pushes them to screens throughout your organization.
We solve the adoption problem by removing the friction of logging in.
Displaying Power BI Dashboards on TVs
RocketScreens allows you to broadcast your secure Power BI dashboards to any digital screen. This creates specific use cases for different environments:
- Control Rooms: dedicate large video walls to critical operational metrics.
- Operations Floors: Place screens in common areas showing safety stats and daily targets.
- Drilling Cabins: Give drillers a heads-up display of their performance versus the plan.
- Field Offices: Keep remote sites connected to headquarters with shared information.
Auto-Refresh and Live Updates
Static images are useless in this industry. RocketScreens ensures your dashboards auto-refresh according to your settings. If your SCADA data updates every minute, your screens should reflect that. This ensures that the team is always looking at the current reality, not a screenshot from yesterday.
Shared KPI Screens for Leadership and Field Teams
RocketScreens allows you to curate playlists of content. You can display a high-level financial dashboard for one minute, then rotate to a safety compliance report, and then to a live weather map. This keeps the content fresh and ensures leadership sees a holistic view of the business without touching a keyboard.
Connecting 100+ Tools Beyond Power BI
Oil and gas operations rarely run on a single piece of software. While Power BI is the heavyweight for analytics, you likely use other tools for project management, finance, or HR. RocketScreens integrates with over 100 applications (like Salesforce, Asana, Microsoft Teams, Google Sheets, and more), allowing you to build a comprehensive digital signage strategy that goes beyond just charts and graphs.
Real Examples of Power BI Dashboards to Display on Screens
If you are ready to display your data, which dashboards offer the most value? Here are real-world examples of what our oil and gas clients display on their screens.
Real-time Production Dashboard
This is the heartbeat of the company. Display this in the main office and the field manager’s office.
- Metrics: Net daily production, barrel oil equivalent (BOE), water cut percentage, and gas-to-oil ratio.
- Goal: Keep everyone focused on meeting the daily quota.
Drilling Performance Dashboard
Ideal for the drilling engineering team and the rig site.
- Metrics: Footage drilled last 24 hours, Rate of Penetration (ROP), drilling mud properties, and comparison of actual vs. planned well depth.
- Goal: Optimize drilling speed and reduce costly rig time.
HSE Incident Tracker
This is essential for every breakroom and hallway to reinforce a safety culture.
- Metrics: Total Recordable Incident Rate (TRIR), days without a lost-time injury, open safety observations, and required training status.
- Goal: Keep safety top-of-mind and reduce preventable accidents.
Pump and Compressor Health Dashboard
Best suited for the maintenance and reliability engineering teams.
- Metrics: Vibration levels, temperature trends, runtime hours, and predictive maintenance alerts.
- Goal: Shift from reactive repairs to proactive maintenance.
Pipeline Flow and Pressure Monitor
Critical for midstream control rooms.
- Metrics: Inlet/outlet pressure, flow rate velocity, tank levels, and batch tracking.
- Goal: Maintain system integrity and optimize transport schedules.
Forecast vs. Actual Dashboard
A high-level view for executives and asset managers.
- Metrics: Actual revenue vs. forecast, CAPEX spending vs. budget, and variance analysis.
- Goal: Financial discipline and transparent reporting.
Benefits for Oil & Gas Teams
Implementing a visible data strategy with RocketScreens and Power BI delivers tangible operational benefits.
- Better Communication: Eliminates the "I didn't know" excuse. Everyone sees the same data.
- Faster Decisions: Teams react to trends as they happen, not days later.
- Lower Downtime: Predictive maintenance alerts on screens help crews intervene before equipment fails.
- Stronger Forecasting: Constant visibility into variance helps refine future predictions.
- Safer Operations: Publicly displaying safety stats creates social pressure to follow protocols.
- Fewer Surprises: When trends are visible, small issues are spotted before they become crises.
- More Consistent Performance: Awareness drives behavior. Teams perform better when they know the score.
How RocketScreens Works Step-by-Step
Getting your Power BI content onto a TV screen is straightforward. You do not need a complex IT project to make this happen.
Connect Your Power BI Account
RocketScreens integrates securely with Microsoft. You simply authorize the connection once, and RocketScreens gains the ability to fetch your reports and dashboards. We support Multi-Factor Authentication (MFA) to ensure enterprise-grade security.
Choose What Dashboard to Display
Select the specific reports or dashboards you want to show. You can choose to display an entire dashboard or zoom in on a specific visual that matters most to a particular team.
Set Refresh Rate
Determine how often the data should update. For high-frequency operational data, you might want a rapid refresh. For financial summaries, an hourly update might suffice.
Cast to Office TVs or Screens
RocketScreens works with hardware you likely already have, such as Amazon Fire Sticks, Google Chromecasts, or smart TVs. Pair the device with your account, and your content appears instantly.
Keep Your Team Synced Daily
Create schedules so the right content plays at the right time. Show the safety briefing in the morning, production numbers at lunch, and tomorrow's drilling plan in the afternoon.
FAQs
How does RocketScreens connect with Power BI?
We use a secure API integration. You log in with your Microsoft credentials, and we establish a secure token to display your content. Your data remains within your Microsoft tenant; we just visualize it.
Do dashboards refresh automatically?
Yes. You can configure the refresh intervals to match your Power BI dataset settings, ensuring the screen always shows the latest available data.
Will it work on multiple TVs?
Absolutely. You can manage hundreds of screens from a single web-based portal. You can group screens by location (e.g., "Permian Basin Office" or "Offshore Rig 1") and send different content to each group.
Does it support SCADA-based dashboards?
If your SCADA data is fed into Power BI (or any other web-based analytics tool we support), we can display it.
Do we need special hardware?
No proprietary hardware is required. RocketScreens runs on popular consumer devices like Fire TV, Android TV, Chromecast, and standard web browsers.
How secure is it?
Security is our priority. We use banking-grade encryption and support enterprise security standards to ensure your sensitive oil and gas data remains protected.
Make Your Data Impossible to Ignore
The oil and gas industry has mastered the art of collecting data. The next frontier is ensuring that data actually changes behavior.
Power BI provides the insights, but RocketScreens provides the visibility. By taking your dashboards out of the browser and putting them on the wall, you transform them from passive reports into active drivers of production, safety, and efficiency.
Don't let your valuable analytics sit hidden in a laptop. Make your Power BI oil and gas dashboards visible, shared, and always live.


