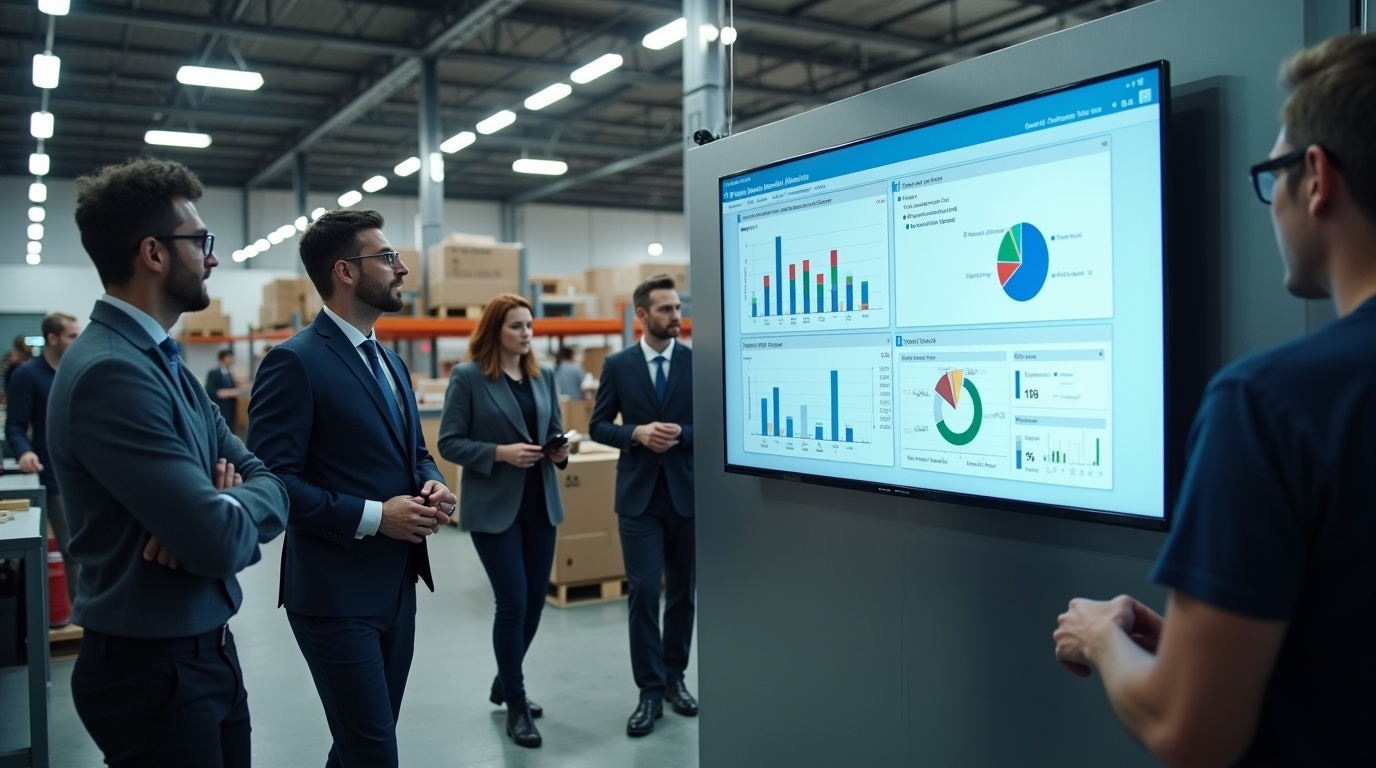
Power BI manufacturing dashboards help production teams visualize live operational data from machines, ERP systems, MES platforms, and quality systems. Instead of relying on end-of-day reports, manufacturers can place dashboards directly on factory floor screens so operators and supervisors see real-time KPIs such as OEE, throughput, downtime, and scrap rates as work happens. This visibility improves decision-making, reduces production losses, and ensures every team shares the same operational view of performance during each shift.
What Power BI Manufacturing Dashboards Are
Power BI manufacturing dashboards are visual reports that combine operational data from multiple factory systems into a single, interactive dashboard. They typically connect to production systems such as:
- Manufacturing Execution Systems (MES)
- Enterprise Resource Planning platforms (ERP)
- Industrial IoT sensors
- Programmable Logic Controller (PLC) logs
- Quality inspection systems
- Maintenance management tools
These data sources feed production, quality, and maintenance information into Power BI, where the platform transforms the data into charts, gauges, tables, and alerts. The dashboards update continuously or at frequent refresh intervals depending on how the systems are connected.
When displayed on large factory screens, the dashboards become operational control boards that show whether a production line is meeting its targets or falling behind.
Why Factory Floor Visibility Matters
Many manufacturing organizations already collect operational data, but the information often remains buried inside reporting tools. Supervisors or analysts may review it later in daily reports or weekly performance meetings.
The challenge is timing.
By the time issues appear in traditional reports, production losses have already occurred. A spike in scrap or an unexpected machine stoppage may have impacted an entire shift before anyone notices.
Real-time dashboards change that dynamic. When KPIs are visible across the factory floor:
- Operators can immediately see when performance drops below target
- Supervisors can respond to downtime faster
- Maintenance teams can prioritize urgent equipment issues
- Quality teams can detect defects before large batches are affected
Visibility encourages faster responses and shared accountability for production results.
Core KPIs Displayed on Manufacturing Dashboards
Manufacturing dashboards focus on a small set of metrics that represent operational performance. These metrics should be easy to interpret from a distance when shown on wall-mounted displays.
The most common KPIs include:
Overall Equipment Effectiveness (OEE)
OEE is one of the most widely used metrics in manufacturing operations. It combines three performance components:
- Availability
- Performance
- Quality
OEE provides a quick snapshot of how effectively a production line operates compared to its full potential. On a dashboard, OEE often appears as a large gauge or KPI card showing current performance versus the shift target.
Throughput and Production Rate
Throughput measures how many units a production line completes within a specific time period. Dashboards often show:
- Units produced per hour
- Actual output vs production targets
- Production rate trends over time
This helps supervisors identify bottlenecks and production slowdowns as they happen.
Downtime and Equipment Status
Equipment downtime can significantly impact production efficiency. Manufacturing dashboards often display:
- Total downtime minutes
- Downtime percentage
- Top downtime causes
- Current machine status
Visual indicators such as red or yellow status icons quickly show whether equipment is running, idle, or stopped.
Quality Metrics
Quality performance is another critical element displayed on factory dashboards. Key indicators include:
- Scrap rate
- Defect rate
- First-pass yield (FPY)
- Rework counts
Trend charts allow teams to identify quality issues before they affect large production volumes.
Maintenance and Reliability KPIs
Maintenance dashboards help teams monitor equipment reliability and service performance. Common metrics include:
- Mean Time Between Failures (MTBF)
- Mean Time to Repair (MTTR)
- Open maintenance work orders
- Planned vs unplanned downtime
When these metrics are visible in production areas, teams coordinate faster when equipment issues arise.
Common Types of Factory Floor Dashboards
Most manufacturers deploy multiple dashboard types depending on the production environment and operational priorities.
Production Performance Dashboards
Production dashboards focus on the overall output and efficiency of manufacturing lines.
Typical metrics include:
- OEE by line or machine
- Production rate vs target
- Shift output totals
- Downtime events
These dashboards help line supervisors monitor performance during each shift.
Quality Monitoring Dashboards
Quality dashboards focus on detecting defects and maintaining process stability.
They often display:
- First-pass yield
- Defect counts
- Scrap trends
- Statistical process control charts
Operators can quickly identify when processes move outside acceptable limits.
Equipment Health Dashboards
Equipment dashboards monitor machine conditions and predictive maintenance indicators.
Typical information includes:
- Machine status indicators
- Temperature and vibration readings
- Maintenance alerts
- Downtime reasons
Maintenance teams often use these screens in maintenance rooms or control areas.
Energy and Sustainability Dashboards
Some manufacturers track energy consumption and environmental performance.
These dashboards may include:
- Energy consumption per line
- Energy per unit produced
- Peak energy usage
- Sustainability targets
Making energy data visible helps organizations reduce waste and improve efficiency.
How Power BI Connects to Manufacturing Systems
Power BI integrates with a wide range of operational systems used in manufacturing environments. The platform supports both batch data imports and real-time connections.
Typical integration methods include:
- Direct queries to MES databases
- Streaming data from IoT sensors
- API integrations with ERP platforms
- Scheduled refresh from operational databases
- Push datasets from production monitoring systems
Once data enters Power BI, the platform models the information and creates relationships between different datasets.
This allows teams to analyze production performance by machine, shift, product type, or production line.
Displaying Power BI Dashboards on Factory Screens
Creating a dashboard inside Power BI is only the first step. The real operational value comes from displaying dashboards where teams can see them continuously.
Manufacturers typically place large screens in key production areas such as:
- Production lines
- Quality control stations
- Maintenance work areas
- Operations control rooms
- Plant supervisor offices
Dashboards are usually displayed in full-screen mode so metrics remain readable from a distance.
However, running dashboards directly in browsers can create challenges, including session timeouts, manual logins, and inconsistent refresh behavior.
Digital signage platforms help solve these problems by securely displaying dashboards on TVs while managing refresh schedules and screen access centrally.
How RocketScreens Extends Power BI Manufacturing Dashboards
Many organizations use a digital signage platform to distribute dashboards across multiple factory locations.
RocketScreens connects directly with Power BI and more than 100 business applications to display dashboards on TVs and large displays throughout facilities.
Instead of relying on open browser sessions, RocketScreens delivers dashboards through a secure cloud-based architecture designed for continuous screen visibility.
Key operational capabilities include:
- Centralized screen management across multiple plants
- Automatic dashboard refresh
- Rotation between multiple dashboards on a single screen
- Secure connections to BI platforms
- Scheduling by shift or department
For example, a factory screen might rotate between several dashboards:
- Production performance overview
- Current downtime events
- Quality metrics for the current shift
- Maintenance backlog status
This approach ensures teams always see the most relevant operational information.
Best Practices for Designing Factory Floor Dashboards
Dashboards designed for factory screens require different design principles than dashboards used on laptops.
The following practices help ensure information remains readable and actionable.
Use Large Visual Elements
Operators may view dashboards from several meters away. Large KPI cards and simple charts are easier to read than dense tables.
Limit the Number of Metrics
Too many metrics can overwhelm viewers. Focus on a small set of operational indicators that reflect real performance.
Apply Clear Color Coding
Color indicators help teams interpret performance quickly.
- Green for normal operation
- Yellow for warning conditions
- Red for critical issues
Prioritize Real-Time Information
Factory dashboards should focus on live operational status rather than historical analysis.
Design for Continuous Viewing
Dashboards should update automatically and remain visible without manual interaction.
Common Mistakes When Implementing Manufacturing Dashboards
Organizations often encounter challenges when deploying factory dashboards.
Some of the most common mistakes include:
- Displaying too many charts on one screen
- Using small text that cannot be read from a distance
- Showing historical reports instead of real-time metrics
- Failing to integrate all relevant data sources
- Allowing dashboards to require manual refresh or logins
A well-designed dashboard should function like an operational scoreboard. Teams should immediately understand whether production performance is meeting expectations.
Operational Benefits of Real-Time Manufacturing Dashboards
When dashboards are visible across production areas, several operational improvements occur.
These benefits include:
- Faster response to equipment issues
- Reduced production losses
- Improved communication between teams
- Greater accountability for shift performance
- Better coordination between production and maintenance
Over time, this visibility supports continuous improvement programs and lean manufacturing initiatives.
Scaling Dashboards Across Multiple Facilities
Large manufacturing organizations often operate multiple plants, production lines, and operational departments. Scaling dashboards across these environments requires centralized management of screens and data connections.
Platforms such as RocketScreens enable organizations to distribute Power BI dashboards across multiple locations while maintaining consistent content control.
Operations teams can manage screen content from a central dashboard and deploy updates to every plant without manual configuration.
Frequently Asked Questions
What data sources can Power BI use in manufacturing environments?
Power BI can connect to MES systems, ERP platforms, IoT sensors, machine logs, production databases, maintenance systems, and quality inspection tools. These integrations allow organizations to combine production, maintenance, and quality data into unified dashboards.
How often can Power BI manufacturing dashboards update?
Dashboard refresh rates depend on the data connection method. Some dashboards refresh every few minutes using scheduled refresh, while others use streaming or direct query connections for near real-time updates.
Why display dashboards on factory floor TVs?
Displaying dashboards on TVs ensures operators and supervisors see performance metrics continuously. This visibility helps teams respond to downtime, production delays, and quality issues faster.
Can Power BI dashboards be shown across multiple manufacturing plants?
Yes. With the right screen management platform, organizations can distribute dashboards across multiple locations and maintain centralized control over screen content.
What makes a good manufacturing KPI dashboard?
Effective dashboards focus on a small set of operational metrics, use large readable visuals, update automatically, and clearly indicate whether performance meets targets.
Bring Real-Time Manufacturing Visibility to Your Factory Screens
Power BI provides powerful analytics capabilities for manufacturing data, but dashboards deliver the most operational value when teams can see them continuously during production.
RocketScreens helps manufacturers securely display Power BI dashboards on TVs and digital signage screens across factory floors, control rooms, and production areas. With centralized screen management, automatic refresh, and multi-location scalability, organizations can ensure production, maintenance, and quality metrics remain visible to the teams responsible for daily operations.
If you want to bring real-time manufacturing dashboards to your production environment, explore the RocketScreens platform or schedule a demo to see how factory floor KPI screens can improve operational visibility.


