A sales TV dashboard turns your live CRM data into a shared scoreboard that every rep and manager can see throughout the day. When pipeline, targets, and win-rate metrics are always on screen, performance becomes harder to ignore and easier to act on. Teams that rely on weekly report emails or on-demand pulls from Salesforce lose hours chasing status updates that a single TV screen could answer instantly.
What a Sales TV Dashboard Actually Does
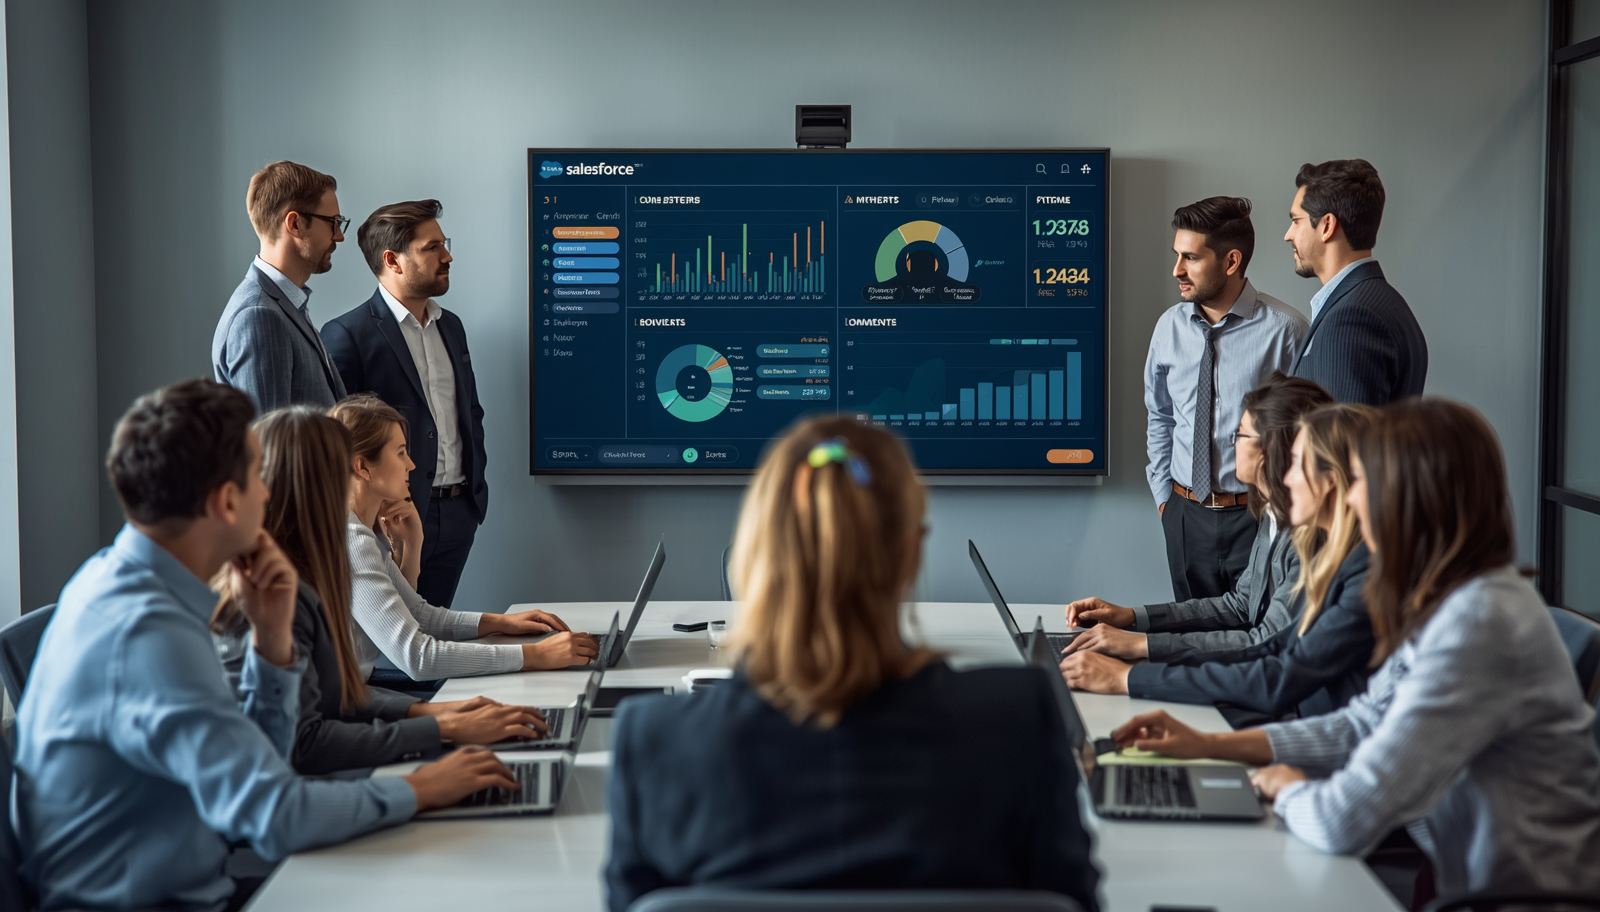
A sales TV dashboard is a live display mounted on office screens - conference rooms, open floors, breakout areas - that pulls real-time data from your CRM or sales platform and presents it as a visual scoreboard.
It is not a static report. It is not a slide deck someone refreshes once a week. It updates continuously so the numbers on screen match what is actually happening in your pipeline right now.
The core job is simple: make quota progress visible to everyone, all the time, without anyone needing to open a laptop or ask a manager where things stand.
Why Sales Teams Still Struggle Without Dashboard Visibility
Most sales teams have data. The problem is access friction. Reps check Salesforce when they remember to, not continuously. Managers pull reports before 1:1s, not between them. That gap between data and awareness is where opportunities stall.
When visibility is low, three things tend to happen:
- Reps lose track of where they stand against quota mid-month
- Managers discover pipeline problems in weekly reviews instead of in real time
- Teams hold more status meetings to compensate for the missing shared view
A sales TV dashboard closes that gap by making the data ambient. It does not require anyone to pull a report. The scoreboard is just always there.
Key Metrics to Show on a Sales TV Dashboard
The most effective dashboards focus on a small set of high-signal metrics rather than filling the screen with every available field. More numbers do not mean more clarity.
Metrics that consistently deliver value on office TV displays:
- Quota attainment - individual and team progress against monthly or quarterly targets
- Pipeline health - total open value and stage-by-stage breakdown
- Forecast accuracy - committed vs. best case vs. actual close rates
- Win rate - closed-won deals as a percentage of total opportunities
- Deal velocity - average time from opportunity creation to close
- Average close time - useful for spotting deals that have stalled beyond their normal cycle
- Funnel stage conversion - where deals are dropping off and at what rate
Managers use these metrics to spot stalls early and prioritize coaching effort. Reps use them to stay oriented on what matters today, not what was discussed in last week's forecast call.
How Visibility Speeds Up Sales Performance
The benefit of a sales TV dashboard is not just reporting. It is ambient accountability. When your team can glance at a screen and see exactly where everyone stands, the dynamics of the floor shift.
Reps who can see their progress against quota throughout the day are more likely to act with urgency before end of month, not in the last 72 hours. Real-time visibility reinforces follow-through because the gap between current performance and target is never hidden.
For managers, the win is fewer interruptions. When the dashboard shows the current state of the pipeline, you can skip the "where are we?" part of every 1:1 and go straight to what needs to change. That kind of meeting compression adds up fast across a team of ten or twenty reps.
Shared screens also align the team on the same version of the numbers. No one is working from a spreadsheet export from three days ago. Everyone is looking at the same live data, which makes cross-team coordination faster and easier.
Operational Impact for Sales Leaders
Sales directors and VPs of Revenue who have implemented TV dashboards consistently report two categories of impact: time savings and decision speed.
Time savings come from reducing the number of manual status updates, email threads about where the team stands, and meetings called to answer questions the dashboard already answers. Depending on team size, this can free up several hours per manager per week.
Decision speed improves because lagging indicators become visible earlier. If a rep's pipeline is thin going into the third week of a quarter, that shows on the TV dashboard before it becomes a missed number. Managers can intervene with deal support, coaching, or resource reallocation while there is still time.
The underlying mechanism is simple: problems you can see are problems you can fix. Problems buried in reports only surface after the damage is done.
How to Set Up a Sales TV Dashboard
Getting a working TV dashboard for your sales floor does not require a large technical project. The typical setup follows a clear path:
Step 1 - Choose your data source
Identify where your sales data lives. For most teams, this is Salesforce, HubSpot, or a similar CRM. Confirm what dashboards or reports are already built and which metrics you want to display.
Step 2 - Pick a display platform
You need software that can pull your CRM data and push it to a TV screen. This is where a digital signage platform with native integrations matters. You want something that connects directly to your CRM rather than requiring manual exports.
Step 3 - Configure your screens
Decide which screens will show which dashboards. A large sales floor might show team quota progress on a central display and individual rep metrics on smaller screens near each pod. Plan your layout before configuring content.
Step 4 - Set up content scheduling
Most teams benefit from showing different dashboards at different times. Morning views might focus on pipeline and today's tasks. Afternoon views might shift to forecast and close probability. A good platform lets you schedule this automatically.
Step 5 - Test and calibrate
Run the display for a week and gather feedback from reps and managers. Which metrics are actually being looked at? What is causing confusion? Adjust content and layout based on real use, not assumptions.
Industry Use Cases
TV dashboards for sales teams are widely used across industries where quota accountability and pipeline visibility matter most.
SaaS and software companies use them to track ARR progress, renewal pipeline, and expansion revenue alongside new business. Sales and customer success teams can share screens showing both acquisition and retention metrics side by side.
Financial services and insurance firms use TV dashboards to display policy sales, premium volume, and advisor performance against monthly targets, keeping large distributed teams aligned on a shared number.
Real estate and mortgage companies benefit from dashboards that show deal velocity and loan pipeline status, which helps identify bottlenecks between origination and closing.
Enterprise B2B sales teams use TV dashboards to keep long-cycle deal progress visible. When average deal cycles run six to twelve months, having pipeline stage data always on screen helps managers catch at-risk accounts before they go cold.
Displaying Salesforce Dashboards on Office TVs with RocketScreens
RocketScreens is built to display Salesforce dashboards and reports directly on office television screens as live digital signage. The integration pulls your existing Salesforce data and renders it on screen in real time, without requiring reps or managers to log in or switch between tools.
The platform supports multiple dashboards across multiple screens, content scheduling by time or location, and channel-based organization so different teams can see the metrics most relevant to their work. With support for over 100 app integrations, you can combine Salesforce data with other business tools on the same display if needed.
Because RocketScreens operates on a secure, cloud-based architecture, IT teams can manage screen content centrally without needing to touch individual devices. That is especially useful for companies with multiple office locations where maintaining consistent display content manually would be impractical.
The result is a setup where your sales data goes from sitting inside Salesforce to being visible across your entire office - always current, always on, no manual effort required.
Common Challenges When Rolling Out Sales TV Dashboards
Most teams run into a few predictable issues when setting up TV dashboards for the first time.
Showing too many metrics at once is the most common mistake. Screens get cluttered, reps stop looking, and the dashboard becomes wallpaper. Stick to five to eight metrics per view.
Stale or broken data connections undermine trust fast. If the TV shows numbers that do not match what reps see in Salesforce, people stop relying on the display. Make sure your integration is maintained and update intervals are appropriate.
Ignoring the physical placement of screens reduces impact. Dashboards mounted behind people or in low-traffic areas get ignored. Place screens where the team naturally looks - entrance walls, central corridors, near team pods.
No content ownership means dashboards become outdated over time. Assign someone - usually a sales ops person or team lead - to own the dashboard configuration and review it monthly.
Best Practices for Sales TV Dashboards
- Keep each view focused on one question: where are we against target?
- Use colour coding to indicate green (on track), amber (at risk), and red (off target) status without requiring anyone to do mental math
- Rotate dashboards on a schedule so screens stay relevant across the day
- Include individual rep progress alongside team totals - personal accountability drives individual behaviour
- Review dashboard content quarterly and remove metrics the team has stopped using
- Brief new reps on what the dashboard shows and how to read it during onboarding
Mistakes to Avoid
- Displaying vanity metrics that look good but do not drive decisions
- Using dashboards as a performance management tool without pairing them with coaching conversations
- Setting up TV displays and assuming adoption will be automatic - visibility alone does not change behaviour without reinforcement
- Overcomplicating the data model before going live - start simple, add complexity as the team gets comfortable
- Treating the dashboard as a one-time setup rather than an ongoing operational tool
Frequently Asked Questions
What CRM systems can be displayed on a sales TV dashboard?
Most digital signage platforms that support CRM integrations connect to Salesforce, HubSpot, Pipedrive, and similar platforms. RocketScreens specifically supports Salesforce dashboard display on office TV screens. If you use a less common CRM, check whether the platform supports URL-based or API-based data feeds as a fallback option.
How often does the data update on a sales TV dashboard?
Update frequency depends on the platform and integration type. Most modern digital signage solutions refresh CRM data every few minutes. Some support near-real-time updates. For most sales teams, a five to ten minute refresh interval is more than sufficient to keep quota and pipeline metrics current throughout the day.
Is a sales TV dashboard only useful for large teams?
No. Small teams of five to fifteen reps often benefit most because the shared visibility creates a tighter accountability loop when everyone can see the same scoreboard. The setup overhead is low with modern platforms, so even smaller operations can run TV dashboards without dedicated IT support.
Can different screens show different dashboards for different teams?
Yes. Most platforms, including RocketScreens, support multi-channel configurations where each screen or group of screens is assigned specific content. You can show new business metrics on one screen and renewal or expansion pipeline on another, with each view pulling from the same underlying CRM data.
What is the difference between a CRM dashboard and a TV dashboard?
A CRM dashboard is accessed individually through a browser or app and requires a user to log in and navigate to the report. A TV dashboard is a persistent, always-visible display that surfaces that same data passively on a shared screen. The content can be identical - the difference is in visibility, accessibility, and ambient awareness versus on-demand lookup.
Make Your Sales Data Visible Every Day
Quota progress that lives inside Salesforce is useful. Quota progress displayed on a shared screen your entire team can see throughout the day is actionable.
If your sales floor is running on status meetings, report pull requests, and end-of-month surprises, a TV dashboard is the simplest fix available. It does not require a new CRM or a new process - just a way to make the data you already have visible to the people who need it most.
RocketScreens connects your Salesforce dashboards to your office TV screens with minimal setup and no ongoing manual effort. Book a demo to see how your existing sales data can become a live scoreboard your team actually uses.


