Salesforce dashboards for eCommerce give online retail teams a live view of revenue, conversion rates, order performance, and customer behavior in one place. Instead of pulling separate reports, sales, marketing, and operations work from the same numbers and make faster decisions. The real value is visibility: when key metrics are easy to see, teams spot problems earlier, adjust campaigns sooner, and stay aligned on revenue goals throughout the day.
This guide explains what these dashboards track, how they improve team alignment, the common reasons adoption fails, and how live screen displays close the gap between data and action.
What Salesforce Dashboards Do for eCommerce Teams
A Salesforce dashboard collects data from your CRM, commerce platform, and connected tools, then presents it as charts, tables, and summary tiles. For an online retail business, that means the metrics buried inside reports become something a whole team can read at a glance.
The practical outcome is shared context. A marketing manager checking campaign performance sees the same conversion data as the operations lead watching fulfillment. That removes the lag and disagreement that come from teams running their own spreadsheets.
Dashboards also support both strategic and day-to-day work. Leadership uses them to track progress against quarterly targets, while frontline teams use them to react to what is happening right now, such as a stockout, a spike in returns, or a campaign that suddenly starts converting.
Why Dashboard Visibility Matters for eCommerce Growth
Data only creates value when people act on it. A dashboard that lives inside the CRM and gets opened once a week rarely changes behavior. Real-time visibility increases agility because teams can course correct while a problem is still small.
For eCommerce specifically, the margins between a good day and a bad one are thin. A drop in conversion rate, a slow-loading product page, or a delayed shipment can each cost revenue within hours. Visible metrics shorten the time between something going wrong and someone noticing.
Shared dashboards also build accountability. When the same numbers are visible to everyone, ownership becomes clearer and decisions move faster. Wins get recognized in the moment, and underperformance is harder to ignore.
Key Metrics eCommerce Teams Should Track
Effective Salesforce ecommerce analytics start with a focused set of metrics rather than every available data point. Crowded dashboards hide the signal that matters.
The core metrics most online retail teams monitor include:
- Revenue today, this week, and against target
- Conversion rate across the funnel
- Average order value (AOV)
- Units sold and top-selling products
- Open opportunities and pipeline value
- Lead sources and channel performance
- Site performance and page health
- Inventory levels and stockouts
- Fulfillment status and shipping delays
- Return rates and reasons for returns
Grouping these by team keeps each dashboard relevant. Marketing focuses on channel and conversion data, sales tracks pipeline and revenue, and operations watches inventory, fulfillment, and returns.
How Dashboards Improve Alignment Across Sales, Marketing, and Operations
Misalignment in eCommerce usually comes from different teams measuring success differently. Marketing reports on traffic, sales reports on closed revenue, and operations reports on shipments. Each is correct in isolation, but none sees the full picture.
A shared Salesforce dashboard connects these views. When marketing can see that a campaign drove traffic but conversions stalled, the conversation shifts from blame to problem solving. When operations sees a revenue spike coming, they can prepare fulfillment capacity ahead of time.
This alignment also speeds up cross-team decisions. A returns trend visible to both operations and marketing can trigger a product page fix and a messaging change at the same time, rather than weeks apart.
How to Build a Useful eCommerce KPI Dashboard
Building an effective dashboard is less about adding metrics and more about deciding what each viewer needs to act on. A clear setup process keeps dashboards practical.
A reliable approach follows these steps:
- Define the decision each dashboard supports, then choose only the metrics tied to it
- Identify the audience, since a leadership view differs from an operations view
- Connect your data sources so the dashboard reflects live commerce, CRM, and fulfillment data
- Set clear thresholds and targets so viewers know what good and bad look like
- Choose chart types that communicate quickly, such as trend lines for revenue and gauges for targets
- Test the dashboard with the actual team that will use it and remove anything they ignore
- Review and refine on a set schedule as priorities change
The goal is a dashboard someone can read in seconds and act on immediately, not a report that needs interpretation.
Real-World Examples of What eCommerce Teams Display on Screen
The strongest use of a sales dashboard for online retail is keeping it visible all day rather than checking it occasionally. Several views work well as always-on displays.
A daily revenue board shows revenue today against target, AOV, and units sold, giving the team a constant pulse on performance. A conversion view tracks funnel drop-off and channel performance so marketing can react to a stalling campaign within hours.
An operations board displays order volume, fulfillment status, and shipping delays so the warehouse and support teams stay ahead of issues. A customer health view surfaces return rates and support trends, flagging product or experience problems early.
During peak periods like sales events, a shared promotion board keeps every team focused on the same goals and celebrates milestones as they happen.
Common Challenges That Reduce Dashboard Adoption
Most dashboard problems are behavioral, not technical. The data is available, but it does not change how the team works. Recognizing the common failure points helps you avoid them.
Frequent challenges include:
- Dashboards that are too crowded, so the important metric gets lost
- Reports that live inside the CRM and get opened rarely
- Metrics defined differently across teams, creating disputes over the numbers
- Stale data that erodes trust in the dashboard
- No clear owner responsible for keeping the view accurate
- Vanity metrics that look impressive but drive no decisions
The underlying issue is almost always the same: if people do not see the dashboard regularly, it cannot influence their decisions.
Best Practices for eCommerce Salesforce Dashboards
A few consistent habits separate dashboards that drive growth from those that gather dust. Keep each dashboard focused on a single audience and purpose. A leadership board and a warehouse board should not look the same. Limit the number of metrics so the most important ones stay prominent.
Make targets explicit. A number without context is hard to act on, but a number shown against a clear target tells the team instantly whether to celebrate or intervene. Keep the data current, since real-time reporting only helps when teams trust that what they see is accurate.
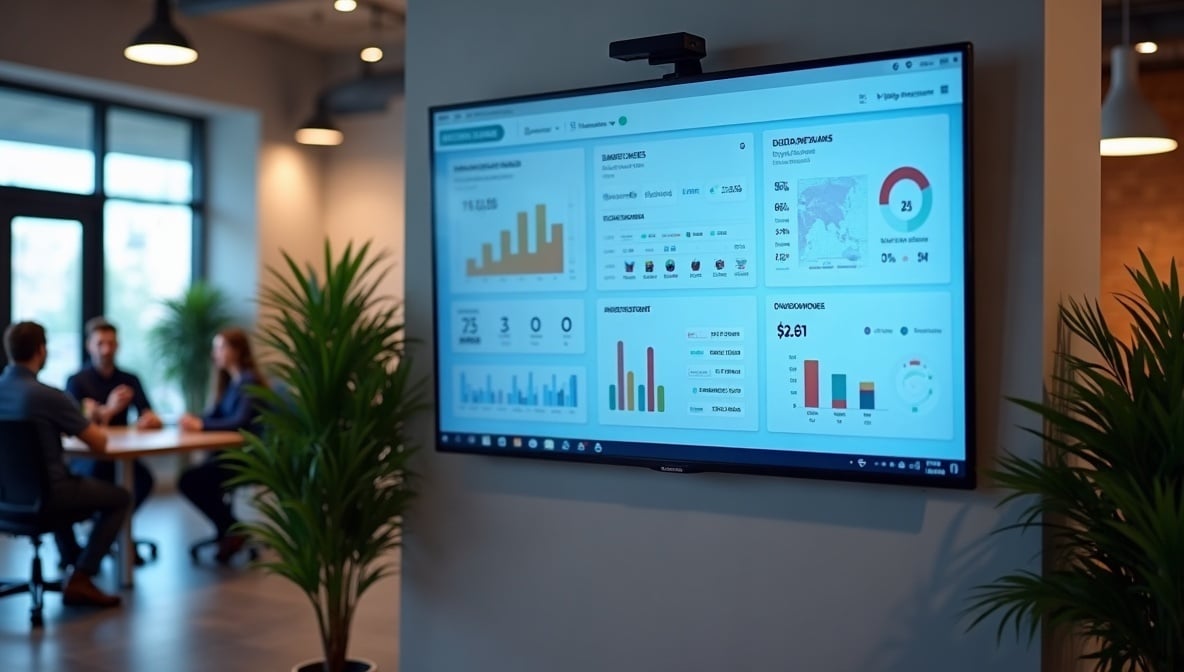
Most importantly, make dashboards visible where work happens. A dashboard that requires a login and a few clicks compete with everything else on a busy screen. One displayed on a shared office TV becomes part of the team's daily awareness.
Mistakes to Avoid
Several recurring mistakes undermine otherwise good dashboards. Avoid building one giant dashboard for the entire company, since it serves no one well. Avoid tracking metrics simply because they are available, as this clutters the view. Avoid letting data go stale, because a single wrong number can make a team distrust the whole dashboard.
Do not treat the dashboard as a build-once project. Priorities shift, product lines change, and a dashboard that is not reviewed slowly drifts away from what the team actually needs. Finally, do not assume that creating a dashboard means people will use it. Without visibility and a clear owner, even a well-designed view fades into the background.
How RocketScreens Displays Salesforce Dashboards on Office TVs
This is where the visibility gap gets solved. RocketScreens displays Salesforce dashboards live on office TVs, so teams see the same KPIs throughout the day instead of checking them occasionally inside the CRM.
The platform uses secure, cloud-based architecture and supports 100+ integrations, which lets eCommerce teams pull data from Salesforce alongside their other tools onto a shared screen. Centralized screen management means an admin can update what every display shows from one place, and content stays current automatically through real-time dashboards.
For businesses running multiple offices or warehouses, multi-location scalability keeps every site looking at consistent, up-to-date metrics. Enterprise-grade reliability means the screens keep running without manual intervention, so the dashboard becomes a dependable part of the workspace.
In practice, an eCommerce team might show revenue today, conversion rate, pipeline value, fulfillment status, and returns across a few shared screens. That turns Salesforce data from something people check into something the whole team sees and acts on continuously.
Frequently Asked Questions
What Salesforce metrics matter most for eCommerce growth?
Revenue against target, conversion rate, AOV, fulfillment status, and return rates are the highest-value metrics for most eCommerce teams. These connect directly to revenue and customer experience, which makes them practical to act on rather than simply interesting to watch.
How often should eCommerce dashboards update?
For operational metrics like orders, fulfillment, and inventory, real-time or near real-time updates are ideal because delays cost revenue. Strategic metrics such as monthly revenue trends can update less frequently. The key is matching update speed to how quickly a team needs to react.
Which teams should use Salesforce dashboards?
Sales, marketing, operations, and support all benefit, but each needs a view tailored to its decisions. Shared dashboards work best when they give every team a common reference point while still letting each group focus on the metrics it owns.
Why do dashboards fail when people do not open them?
A dashboard influences decisions only when it is seen regularly. If it stays inside the CRM and gets checked occasionally, it cannot shape day-to-day behavior. Making dashboards continuously visible, such as on shared office screens, is what turns the data into consistent action.
How does RocketScreens help teams use Salesforce data better?
RocketScreens displays Salesforce dashboards live on office TVs, keeping KPIs in front of teams all day. Combined with secure cloud architecture, centralized management, and support for many integrations, it removes the friction of logging in and checking reports, so visibility becomes automatic.
Turn Your Salesforce Data Into Daily Action
If your eCommerce metrics live in reports that few people open, you are leaving growth on the table. Putting Salesforce dashboards on shared screens keeps every team aligned on the numbers that drive revenue.
Book a RocketScreens demo to see how live Salesforce dashboards look on your office TVs, or talk to our team about a setup tailored to your sales, marketing, and operations workflows.


