Salesforce reporting best practices for logistics managers are less about building more reports and more about building the right ones, then making sure people actually see them. In transport, warehousing, and distribution operations, decisions are made in minutes, not quarters. A dashboard that answers a question three hours late has already failed. This guide covers the metrics logistics teams should track in Salesforce, how to structure reports so they stay usable, the mistakes that quietly kill dashboard adoption, and how to move critical operational data out of the CRM and onto screens where teams can act on it.
Why Salesforce Matters in Logistics and Supply Chain Operations
Most logistics organizations run on fragmented systems. A TMS handles routing, a WMS handles inventory, a customer portal handles service requests, and finance sits somewhere else entirely. The result is that nobody has a single view of the customer or the shipment.
Salesforce is often adopted to close that gap. It becomes the layer where shipper accounts, service cases, contract terms, and exception history live together. When it is configured well, a dispatcher, an account manager, and a customer service lead are all looking at the same record.
That shared context matters more in logistics than in most industries because the cost of a communication gap is physical. A missed exception becomes a detained truck. A delayed case response becomes a lost contract renewal. Reporting is how that context gets surfaced.
What Logistics Managers Should Actually Measure
The common failure is measuring what is easy to pull rather than what drives action. A logistics reporting set should map to the operational pressures the team feels during a shift.
Core categories worth building around:
- Shipment status and movement: in transit, at risk, delivered, and held. Volume by lane or region if you operate multi-site.
- Delivery exceptions: count, reason code, age, and owner. Exception aging is often more useful than exception count.
- On-time delivery performance: tracked by customer and by carrier, not just as a company-wide average.
- Fulfillment and order accuracy: orders shipped complete, short-shipped, and returned.
- Inventory visibility: stock position against commitments, backorder exposure, and slow-moving units.
- Service case load: open cases, first response time, resolution time, and escalations by account.
- Customer health: satisfaction scores, complaint frequency, and renewal risk flags tied to service performance.
Each of these should have a clear owner. A metric without an owner becomes a number people look at rather than a number people move.
Salesforce Reporting Best Practices for Logistics Managers
The following practices consistently separate reporting systems that get used from ones that get ignored.
1. Define the KPI before you build the report
Write the definition in plain language first. What counts as on-time? Is it the promised date or the revised date? Does a partial delivery count? Logistics teams argue about these definitions constantly, and unresolved definitions produce reports nobody trusts.
2. Build one report per decision, not one report per data source
Start with the decision the report supports. If the decision is "which exceptions do we escalate this afternoon," the report should show exactly that, sorted by urgency, with nothing else competing for attention.
3. Keep dashboards to a readable density
Three to five components per dashboard view is a workable ceiling for operational use. Executive dashboards can carry more because they are reviewed deliberately. Floor-level dashboards cannot, because they are scanned in seconds.
4. Add context to every chart
A number without a comparison is not information. Show the target, the prior period, or the threshold alongside the current value. A 94% on-time rate means nothing until the reader knows whether the commitment was 92% or 98%.
5. Enforce data hygiene at the entry point
Duplicate accounts, inconsistent reason codes, and free-text status fields are the most common causes of unreliable logistics reporting. Validation rules, required picklists, and standardized exception codes do more for report quality than any dashboard redesign.
6. Watch report performance
Reports pulling large object volumes across long date ranges will slow down and time out. Filter by date range, use report types built for the objects you actually need, and archive historical data rather than querying it live.
7. Set a review cadence
Audit your dashboards quarterly. Delete what nobody opens. Every unused report is clutter that makes the useful ones harder to find.
How to Implement a Logistics Reporting Structure
A practical rollout sequence looks like this:
- Step 1: Map decisions, not data. Interview dispatch, warehouse, and customer service leads. Ask what decisions they make daily and what they currently lack to make them.
- Step 2: Standardize the data model. Agree on exception reason codes, status values, and account hierarchy before building anything.
- Step 3: Build a tiered dashboard set. Operational (shift level), managerial (daily and weekly), and executive (monthly). Do not force one dashboard to serve all three.
- Step 4: Assign ownership. Every dashboard gets a named owner responsible for accuracy and relevance.
- Step 5: Distribute visibility. Decide where each dashboard will be seen: in Salesforce, in a scheduled email, or on a screen in the operations area.
- Step 6: Review and prune. Track dashboard usage in Salesforce and retire anything with no engagement after 90 days.
Common Reporting Mistakes in Logistics Operations
Certain patterns show up repeatedly in logistics Salesforce implementations.
Dashboard sprawl. Teams build a new dashboard for every request instead of improving an existing one. Within a year there are forty dashboards and no shared source of truth.
Reporting on averages only. An average on-time rate hides the two accounts that are failing badly. Segment by customer, lane, and carrier.
Stale benchmarks. Targets set two years ago against a different volume profile still sitting in the dashboard, quietly making performance look better or worse than it is.
Overloaded operational views. Twelve components on a screen that someone glances at while walking past the dock. Nothing registers.
Reports built for the person who requested them, not the person who uses them. A director asks for a report, IT builds it exactly as specified, and the floor supervisors who needed it were never consulted.
Data that lives only behind a login. This is the largest and least discussed problem, and it deserves its own section.
Why Visibility Beats Hidden Dashboards
A Salesforce dashboard only creates value when someone looks at it at the moment a decision is available. In practice, that rarely happens.
A warehouse supervisor managing dock flow does not log into a CRM between tasks. A dispatcher handling a delay does not open a browser tab to check exception aging. Even when the dashboard is excellent, the friction of logging in means it gets checked once in the morning and then forgotten.
This creates a gap between data availability and data awareness. The organization technically has visibility, but the people making decisions do not have it in front of them. Meetings then become the mechanism for sharing what a screen could have shown continuously.
The fix is straightforward: move the dashboard to where the work happens.
How RocketScreens Extends Salesforce Visibility
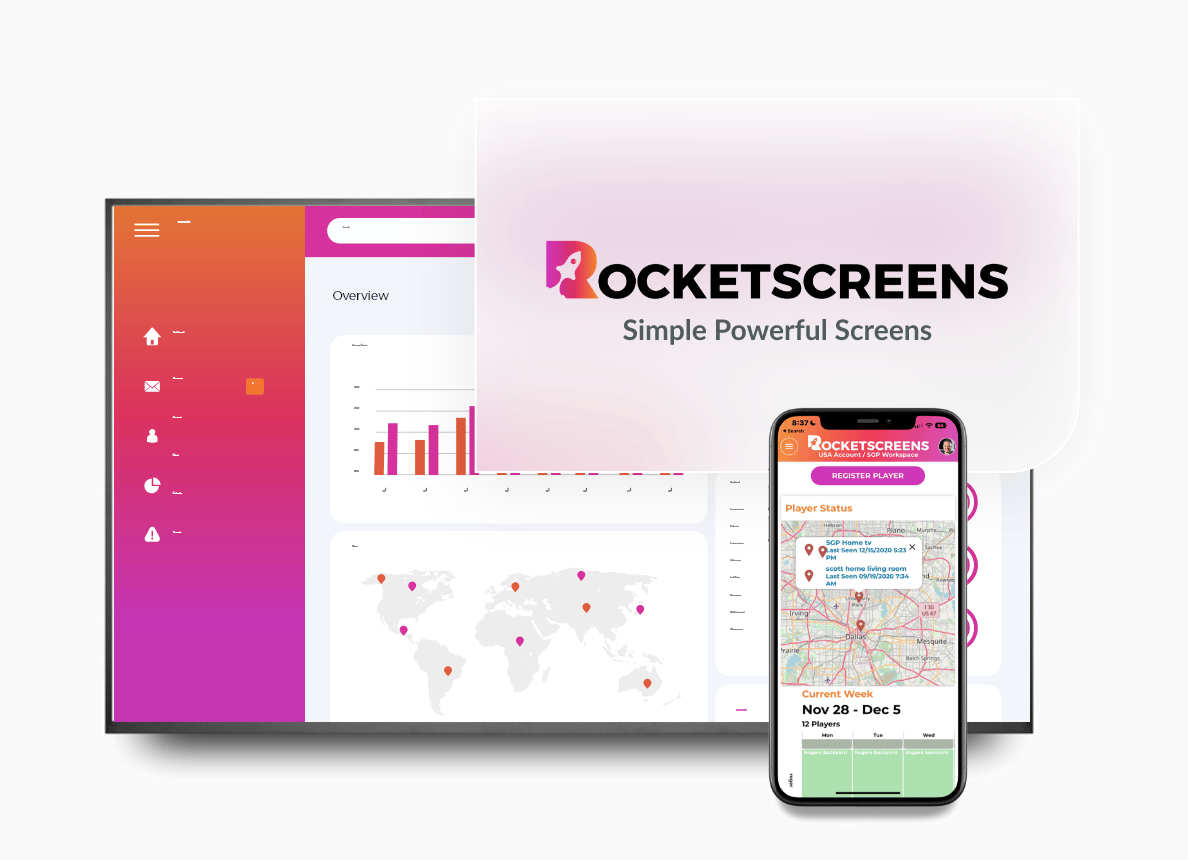
RocketScreens displays live Salesforce dashboards on office and warehouse TV screens, so operational data stays visible without anyone opening the CRM.
Relevant capabilities for logistics environments:
- 100+ integrations. Salesforce dashboards can appear alongside data from a TMS reporting tool, Power BI, Zendesk, or Google Sheets on the same rotation, which matters because logistics teams almost never run on a single system.
- Centralized screen management. Content for every site is managed from one place, so a dashboard change reaches all facilities without local intervention.
- Multi-location scalability. A distribution network with fifteen sites can run site-specific views and network-wide views from the same account.
- Real-time refresh. Displays update on a schedule you control, so exception counts and delivery performance reflect current conditions rather than this morning's snapshot.
- Secure cloud-based architecture. Screen content is served without exposing full CRM access at the display endpoint.
The value is not the screen itself. It is that a metric seen forty times a day gets acted on, while a metric seen once a week gets discussed.
What to Display on a Logistics Operations Screen
Keep each screen to three to five metrics. Rotate views rather than crowding one.
Dock and warehouse screen: open orders to pick, orders shipped today against target, dock congestion or trailer count, and short-shipped orders.
Transport and dispatch screen: shipments in transit, at-risk shipments, open exceptions by age, and on-time delivery rate for the current week.
Customer service screen: open cases, cases breaching first response SLA, escalations, and average resolution time.
Management screen: on-time performance by top customer, fulfillment rate, exception trend over 30 days, and cost per shipment if tracked.
Industry Use Cases Beyond Logistics
The same pattern applies wherever operational data drives fast decisions. Manufacturing plants display production output and downtime against shift targets. Field service organizations display job completion and technician utilization. Retail distribution centers display pick accuracy and outbound volume. In each case the underlying principle holds: the report already exists, the visibility does not.
Business Impact of Visible Logistics Reporting
Organizations that pair disciplined Salesforce reporting with continuous display typically see a few consistent outcomes.
Decisions move earlier in the day because exceptions surface before they compound. Fewer status meetings are needed because the status is already on the wall. Accountability improves because performance is visible to the team, not just to the manager reviewing it later. Cross-functional friction drops because warehouse, transport, and service teams are working from the same numbers rather than reconciling separate versions.
None of this requires new data. It requires better structure and better placement of data you already collect.
Frequently Asked Questions
What should logistics managers track in Salesforce?
Track shipment status, delivery exceptions and their aging, on-time delivery by customer and carrier, fulfillment and order accuracy, inventory exposure, open service cases, and response and resolution times. Segment by customer and lane rather than reporting company-wide averages alone.
How do I make Salesforce reports easier for operations teams to use?
Define each KPI in writing, build one report per decision, limit dashboards to three to five components for floor-level use, include targets or prior-period comparisons on every chart, and review the dashboard set quarterly to remove what is unused.
Why do Salesforce dashboards fail in logistics teams?
Usually because the data is hidden behind a login that operational staff do not open during a shift, or because dashboards are too dense to read quickly, or because underlying data quality issues have eroded trust in the numbers.
Can Salesforce dashboards be displayed on office and warehouse TVs?
Yes. RocketScreens connects to Salesforce and displays live dashboards on screens across one or many sites, with centralized management and scheduled refresh, so teams see current operational data without logging in.
How many metrics should a single operations screen show?
Three to five. Screens are scanned in seconds, not studied. Rotate between multiple focused views rather than compressing everything onto one crowded display.
Make Your Logistics Data Visible Where Decisions Happen
Your Salesforce reports are only as valuable as the number of decisions they influence. If your dashboards are well built but rarely opened, the reporting problem is a visibility problem.
Book a RocketScreens demo to see how your existing Salesforce dashboards look on live operational screens, or speak with our team about a multi-site rollout across your distribution network.