Beyond the Inbox: How to Make Your Salesforce Reports Actually Drive Action
Your company's Salesforce instance is a goldmine. It holds a wealth of information about your customers, your sales pipeline, and the overall health of your business. You and your team spend countless hours building detailed Salesforce reports and dashboards to track every conceivable metric. But here's the hard question: is anyone actually looking at them?
Too often, these critical reports end up buried in a morning email flurry, lost in a sea of browser tabs, or simply ignored. They become a passive resource, a snapshot in time that's already outdated by lunch. The data is there, but it isn't driving action. It isn’t motivating your team or creating alignment.
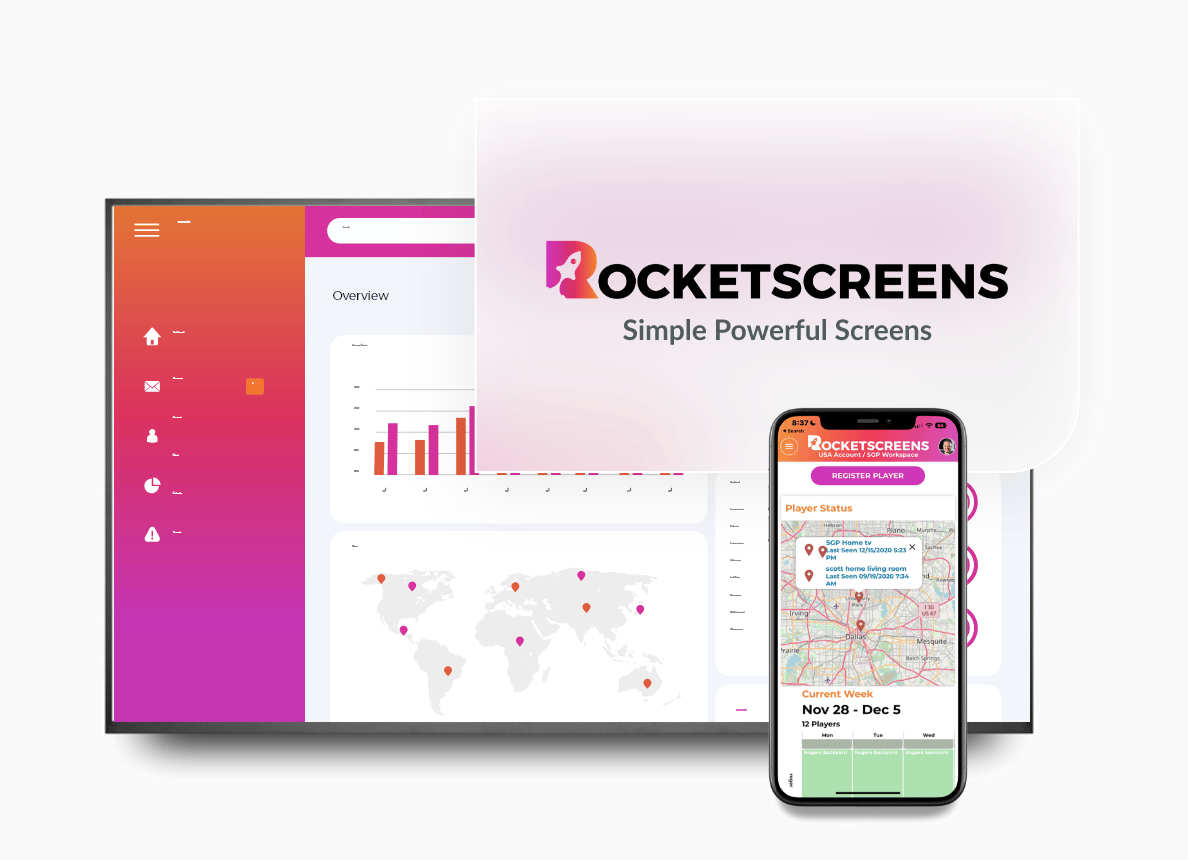
What if you could pull that information out of the digital clutter and place it right in your team's line of sight? Imagine your most important Salesforce reports displayed live on large screens throughout your office. This simple shift transforms data from a passive resource into an active, engaging, and powerful tool for growth. With a secure platform like RocketScreens, you can make this happen effortlessly.
Table of Contents
- Why Traditional Salesforce Report Sharing Falls Short
- The Power of Visibility: Connecting Salesforce Reports to Digital Signage
- 7 Game-Changing Benefits of Displaying Salesforce Reports on TVs
- What Kinds of Salesforce Reports Should You Display?
- How to Securely Display Your Salesforce Reports with RocketScreens
- Final Thoughts: Turn Your Data into Your Greatest Asset
Why Traditional Salesforce Report Sharing Falls Short
Before we explore the solution, it's important to understand why the common methods of sharing data are often ineffective. You might have the best Salesforce reports in the world, but if the delivery system is broken, their impact is minimal.
- The "Out of Sight, Out of Mind" Problem: When data lives exclusively on a laptop or in an email, it's not part of the physical work environment. Your team is focused on their immediate tasks, and logging into Salesforce to check a dashboard is an extra step that easily gets skipped.
- Data Lag: An emailed report is a static picture. By the time a sales rep opens that "End of Day" PDF the next morning, the pipeline has already changed. Decisions are being made on old information.
- Lack of Context: A single report in an email lacks the energy and shared context of the office. It's an isolated piece of information, not a communal scoreboard that everyone can rally around.
- The Engagement Barrier: Let's be honest, for many employees, actively seeking out reports feels like a chore. It's one more thing to do in a busy day. This friction means that only the most diligent team members will consistently check their numbers, leaving others in the dark.
The Power of Visibility: Connecting Salesforce Reports to Digital Signage
This is where digital signage enters the picture, not just as a tool for announcements, but as a dynamic business intelligence dashboard. A platform like RocketScreens acts as a secure bridge between your Salesforce data and any screen in your office.
The connection works in real-time. When a deal is marked "Closed Won" in Salesforce, the leaderboard on the sales floor TV updates instantly. When a new lead comes in, the marketing dashboard reflects it. This isn't a static image of a report; it's a live, breathing view of your business operations. By making data pervasive and impossible to ignore, you change how your team interacts with it.
7 Game-Changing Benefits of Displaying Salesforce Reports on TVs
Moving your Salesforce reports onto large screens isn't just a neat trick; it produces tangible business results. Here’s how this strategy can fundamentally improve your team's performance.
1. Ignite Healthy Competition with Sales Leaderboards
Sales professionals are often naturally competitive. Broadcasting real-time leaderboards taps directly into this drive. Displaying metrics like "Deals Closed This Month," "Top Rep by Revenue," or "Most Dials Made Today" creates a fun and competitive atmosphere. When reps can see their name climbing the ranks in real-time, it provides a powerful incentive to push a little harder. This public recognition is often more motivating than a private email.
2. Create a Single Source of Truth for Your Team
How often have you been in a meeting where people argue over which numbers are correct? "My report says X," "Well, my spreadsheet says Y." When key Salesforce reports are displayed publicly, they become the undeniable source of truth for everyone. This aligns the entire team, from sales and marketing to operations and leadership, around the same set of KPIs. According to insights from Gartner, this alignment is critical for making swift, data-informed decisions.
3. Boost Motivation Through Progress Visualization
Abstract goals like "hit $500k in new revenue this quarter" can feel distant. A goal thermometer or a "Goal vs. Actual" chart on a screen makes that target tangible. Every time a new deal closes, the entire team can watch the bar tick closer to the goal. This shared sense of progress builds momentum and keeps everyone focused on the collective objective, especially during the middle of a long quarter when motivation can dip.
4. Accelerate Onboarding and Training
For a new hire, understanding a company's pulse and priorities can take months. When they walk onto a sales floor and see the key metrics displayed on screens, their learning curve shortens dramatically. They instantly absorb what's important: which activities are tracked, which goals matter most, and who the top performers are. This visual immersion helps them understand the rhythm of the business far faster than any training manual could.
5. Improve Data Transparency and Accountability
When performance metrics are visible to everyone, it naturally fosters a culture of accountability. Team members can see how their individual contributions affect the bigger picture. This transparency also helps managers. Instead of having to chase down reps for updates, the data is readily available. It can also highlight potential issues—like a stalled pipeline stage—early on, allowing managers to intervene with coaching before it becomes a serious problem.
6. Celebrate Wins in Real Time
Don't let major achievements get lost in the shuffle. You can configure your digital signage to trigger special celebrations when certain milestones are hit. Imagine a gong sound and a celebratory graphic flashing on every screen in the office the moment a massive deal is closed. This instant, public recognition for a job well done does wonders for team morale and makes everyone feel part of the success. These shared moments of victory are essential for building a strong and positive team culture.
7. Save Time and Reduce Administrative Overhead
Think about how much time managers spend pulling Salesforce reports, formatting them, and emailing them out to the team. Now, think about the cumulative time the team spends asking, "How are we tracking towards our goal?" An always-on data display automates this entire process. The information is always current and available at a glance, freeing up countless hours that can be reinvested into what really matters: selling, strategizing, and talking to customers. For a deeper dive into report creation, Salesforce's own Trailhead resources are an excellent starting point.
What Kinds of Salesforce Reports Should You Display?
The beauty of this approach is its flexibility. You can display any report or dashboard that is meaningful to your team. Here are a few powerful examples to get you started:
- Sales Activity Reports: Perfect for tracking the daily and weekly hustle. Showcase metrics like calls logged, emails sent, demos booked, and new contacts created.
- Lead Source Effectiveness Reports: Bridge the gap between marketing and sales by displaying which campaigns are generating the most qualified leads and highest conversion rates.
- Opportunity Pipeline Reports: Visualize your entire sales funnel. A chart showing opportunities by stage can instantly reveal bottlenecks where deals are getting stuck.
- Closed Won/Lost Reports: Track your win rate over time and display key reasons for lost deals to facilitate coaching and strategy adjustments.
- Case Reports (for Service & Support): It's not just for sales! Display metrics like open case volume, average resolution time, and customer satisfaction (CSAT) scores to keep your support team aligned and motivated.
- Account-Based Marketing (ABM) Dashboards: Track engagement levels across your target accounts to ensure your most important prospects are getting the attention they need.
How to Securely Display Your Salesforce Reports with RocketScreens
Bringing your data to the big screen might sound complex, but with a modern digital signage platform, it's remarkably straightforward and secure.
- Simple, Secure Connection: The first step is connecting your Salesforce account. RocketScreens uses secure, industry-standard authentication (OAuth 2.0). This means you log in directly with Salesforce, and RocketScreens is only granted read-only permission. Your CRM data is never altered or compromised, ensuring complete security and data integrity.
- Choose Your Reports & Dashboards: Once connected, you can browse and select the exact Salesforce reports and dashboards you already use. There's no need to rebuild anything. Simply point and click to choose what you want to display. Learn more about our Salesforce integration.
- Customize Your Display: You aren't limited to showing just one report. Create a dynamic layout that combines your sales leaderboard with a company announcements ticker, a motivational YouTube video, or a weather widget. This keeps the screen content fresh and engaging for your team.
- Broadcast Anywhere: Pair your screens with a compatible media player, and you're ready to go. You can manage the content for one screen in a single office or hundreds of screens across the globe, all from one simple, web-based platform. Explore different ways teams are using our solutions.
Final Thoughts: Turn Your Data into Your Greatest Asset
Your Salesforce data is one of your company's most valuable assets, but only if it's used. By freeing your Salesforce reports from the confines of the computer screen and displaying them in the open, you transform them from passive documents into active drivers of performance.
Visible data is actionable data. It fosters alignment, sparks competition, motivates action, and creates a transparent, data-driven culture. Stop letting your most important business metrics hide in plain sight. It’s time to put them on display and watch your team’s performance soar.
Ready to bring your Salesforce reports to life? See how easy it is to get started with RocketScreens.


