You have the data. Your team logs their calls (mostly). You have built the reports in Salesforce. Yet, looking at the end-of-month numbers often feels like a surprise. Why is there a disconnect between the data sitting in your CRM and the actual daily behavior of your sales team?
The answer usually isn't a lack of data; it's a lack of visibility.
Salesforce is a powerful warehouse for information, but it is passive. It waits for you to log in, search, and click through tabs. This article explores Salesforce RocketRankings—the concept of structuring your Salesforce data into competitive performance tiers, and how you can take that data out of the browser and onto the walls of your office using RocketScreens.
When you turn static reports into live digital signage, you stop guessing about performance and start driving it.
What Salesforce RocketRankings Is
Salesforce RocketRankings is a performance-ranking setup within Salesforce designed to help teams track who is winning, who needs coaching, and how the pipeline is moving in real-time. While Salesforce doesn’t have a button labelled "RocketRankings" out of the box, this term refers to the strategic configuration of reports and dashboards to build leaderboards, scorecards, pipeline rankings, and activity-based competitions.
In simple terms, it converts raw Salesforce data into competitive, easy-to-read rankings that motivate teams and maintain performance transparency. Instead of just seeing a list of leads, a RocketRanking setup shows you exactly where every rep stands relative to their peers and their quota.
How it works inside Salesforce
At a technical level, creating these rankings involves utilising standard Salesforce reporting tools but filtering them for comparative analysis. You group data by "Opportunity Owner" or "Created By," summarise it by key metrics (like deal value or call count), and then sort the results in descending order.
The magic happens when you visualise this. Instead of a spreadsheet view, you use gauge charts, funnel charts, and horizontal bar charts to create a visual hierarchy. This is the foundation of a ranking system. It answers the question: "Who is #1 right now, and how far behind is #2?"
Typical dashboards and scorecards
A well-structured RocketRanking system usually relies on three specific types of views:
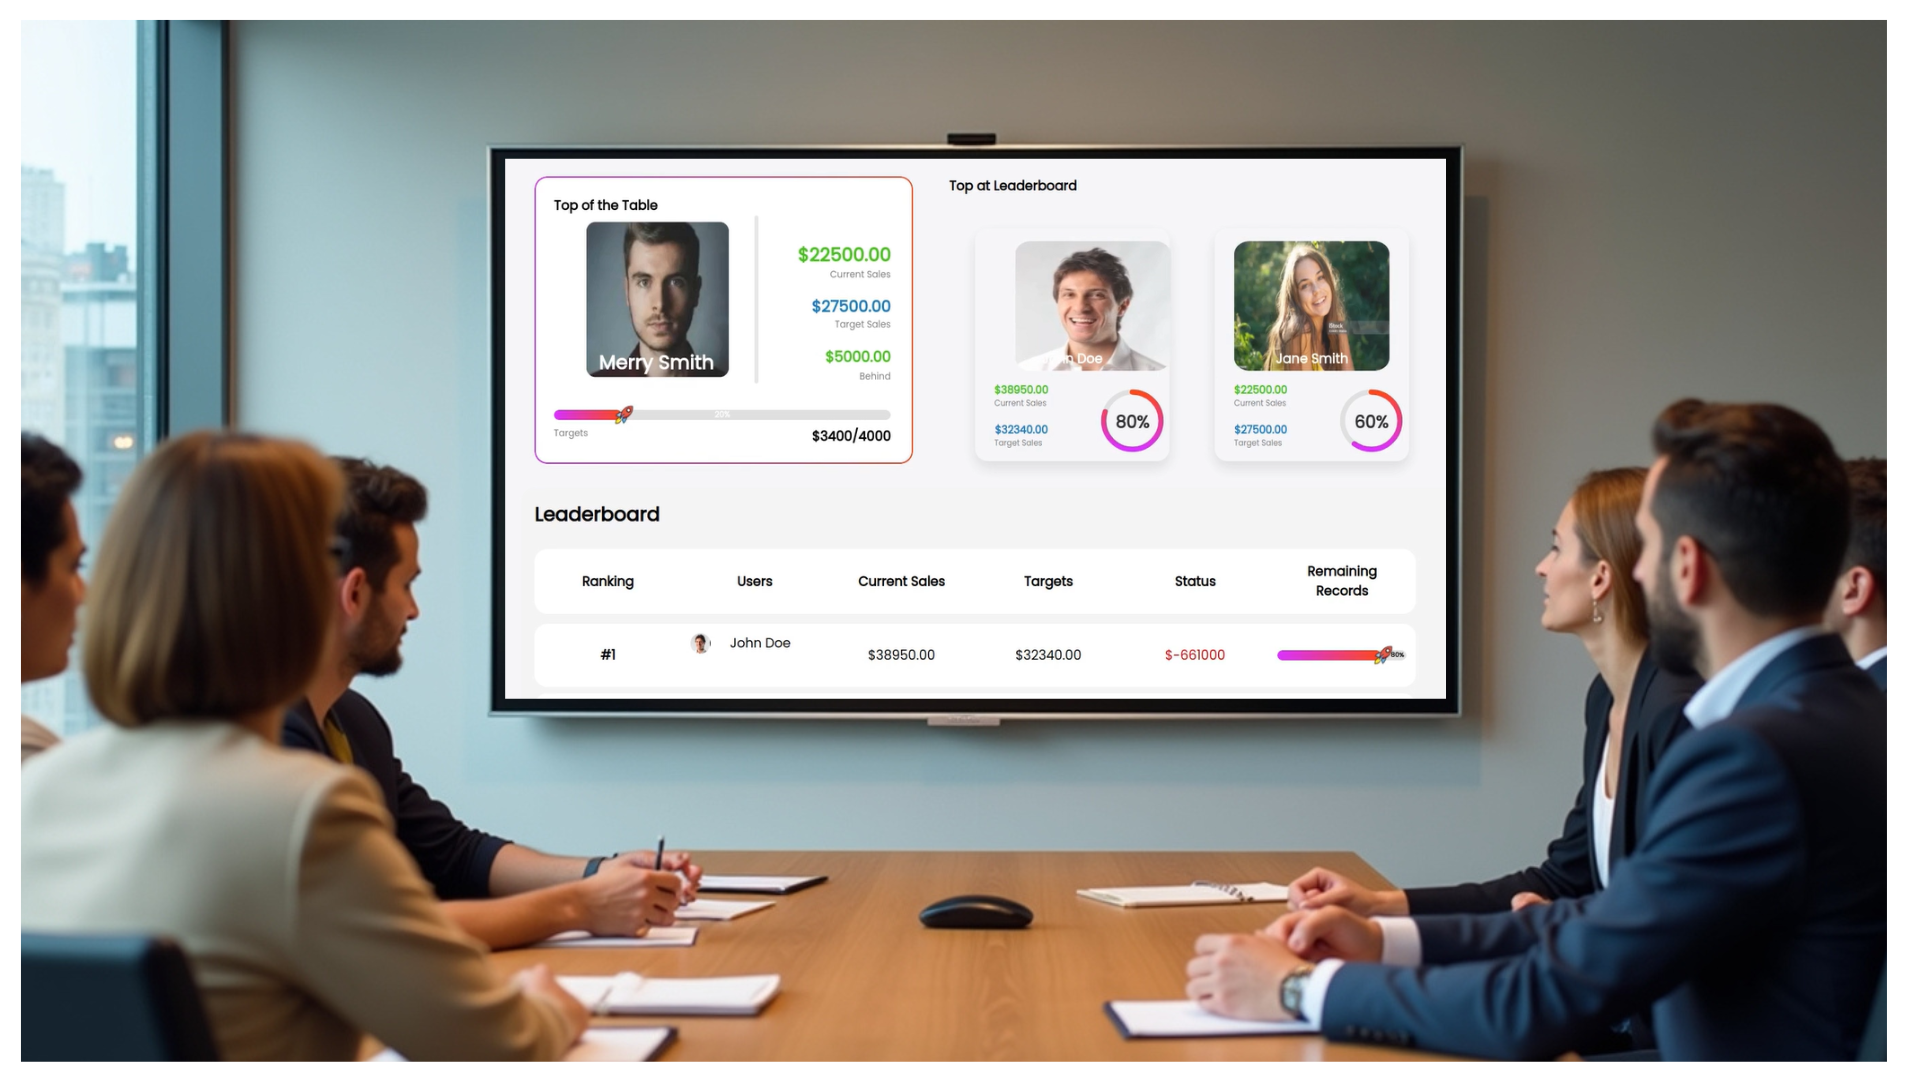
- The Leaderboard: A direct comparison of reps based on a single metric (e.g., "Most Revenue Closed this Quarter").
- The Scorecard: A multi-metric view for individual reps (e.g., "John’s Progress: Calls, Meetings, and Proposals vs. Goal").
- The Team Pace: A collective view showing if the team is on track to hit the monthly or quarterly target.
Metrics teams track every day
For these rankings to be effective, they need to track the right behaviours. Most successful sales teams focus their rankings on a mix of leading and lagging indicators:
- Calls made: The foundational activity metric.
- Contacts added: A sign of effective prospecting.
- Meetings booked: The bridge between activity and opportunity.
- Opportunities created: The beginning of the revenue pipeline.
- Pipeline value: The potential cash flow in the system.
- Deal stage progress: How fast deals are moving from "Qualification" to "Proposal."
- Won deals: The ultimate scoreboard.
- Revenue closed: The bottom line.
- Activity vs. quota: A percentage-based ranking of effort.
- Team vs. region performance: Group-based competition (e.g., "North East vs. West Coast").
Where Teams Struggle With Performance Visibility
You might have the perfect Salesforce leaderboards set up, but that doesn't guarantee success. Even with RocketRankings configured inside Salesforce, teams often hit significant roadblocks regarding engagement. The problem isn't the quality of the metrics; it's the accessibility.
People don’t check Salesforce often
Salespeople are busy. They are on calls, writing emails, or travelling to meetings. Logging into Salesforce, navigating to the "Dashboards" tab, and refreshing a report is a friction point. If it takes three clicks to see the score, most reps won't check it until their manager asks them to. This leads to "blind selling," where representatives operate without knowing exactly where they stand until the end of the week.
Dashboards sit buried in tabs
Browser tab fatigue is real. A sales rep might have 20 tabs open, including LinkedIn, Gmail, research tools, and their calendar. Salesforce is just one more tab that eventually gets buried or closed. When Salesforce performance tracking is hidden behind other windows, its urgency is lost. Out of sight truly means out of mind.
Hard to keep teams aligned
Without a central, shared view of performance, alignment fractures. Marketing might think they are sending enough leads, while Sales feels the pipeline is empty. One rep might think they are crushing it because they closed one big deal, not realizing they are falling behind on activity metrics that predict next month's success. Without a single source of truth visible to everyone, narratives conflict.
Managers spend time chasing updates
"Did you log your calls?" "Update your opportunities." "What's the status on the Smith account?"
Managers waste hours every week acting as human refresh buttons. When the data isn't visible, managers have to constantly remind the team to input data and check their progress. This creates a nagging dynamic rather than a coaching dynamic.
Slow decisions due to scattered data
When insights are not at the forefront, decision-making lags. If a manager only reviews the sales team ranking tools during the Friday meeting, they have lost five days of potential course correction. Real-time visibility allows for real-time adjustments. If Tuesday is slow, you can fix it by Wednesday, but only if you identify the problem on Tuesday.
Why Daily Visibility Changes Team Behavior
Data helps only when people see it.
This is the core philosophy behind public dashboards. If rankings stay buried inside Salesforce, reps don't notice changes, trends, gaps, or opportunities. When teams can see the numbers every day, accountability rises naturally. People adjust faster. Performance improves because everyone knows exactly where they stand.
Consistent focus on goals
When a goal is displayed on a TV screen in the sales pit or on a shared digital wall for remote workers, it becomes the "north star." It is impossible to ignore. A Salesforce activity leaderboard ticking up in real-time serves as a constant reminder of what matters right now. It cuts through the noise of daily administrative tasks, bringing the focus back to revenue-generating activities.
Healthier competition
Salespeople are naturally competitive. It is part of the profession's DNA. When you publicize the rankings, you tap into that psychology. No one wants to be at the bottom of the list. Conversely, the person at the top works harder to stay there. This doesn't have to be cutthroat; it creates a "gamification" effect where moving up the ranks becomes a daily objective.
Better habits and faster reactions
Visible data creates a feedback loop. If a rep sees their call volume is low compared to the team average at 11:00 AM, they have time to pick up the phone and fix it before lunch. Without that visual cue, they might not realize they were behind until the end of the day. Visibility shortens the time between behavior and correction.
A shared understanding of the numbers
When the Salesforce rankings dashboard is public, there are no secrets. Everyone sees the same numbers. This creates a culture of transparency. It eliminates the "I thought I was doing well" conversation because the definition of "doing well" is on the screen for everyone to see.
How RocketScreens Enhances Salesforce RocketRankings
This is where RocketScreens enters the picture. RocketRankings provides the logic and the data structure; RocketScreens provides the delivery system.
RocketScreens is a digital signage platform that securely connects to your applications to display your information anywhere. We take the powerful rankings you have built in Salesforce and put them in front of your entire team.
Display RocketRankings dashboards on office TVs
RocketScreens allows you to cast your Salesforce dashboards directly to TVs in your office. You don't need a dedicated computer plugged into the back of the screen. Our system connects to the display and pulls your Salesforce reports securely, formatting them perfectly for large screens.
Auto-refresh Salesforce metrics
A static screenshot is useless in sales. Things change by the minute. RocketScreens can be set to auto-refresh your Salesforce RocketRankings at intervals you choose. As soon as a rep logs a deal or books a meeting, the screen updates. This real-time feedback loop is essential for maintaining momentum on the sales floor.
Build playlists for daily sales motivation
You aren't limited to a single dashboard. With RocketScreens, you can create "channels" or playlists. You might show the "Revenue Leaderboard" for 30 seconds, then rotate to the "New Opportunities" list, then switch to a "Motivation Quote," and finally display a "Company Announcement." This keeps the content fresh and ensures people keep looking at the screen.
Keep remote and hybrid teams aligned
The modern sales team isn't always in the same room. RocketScreens solves this by allowing you to share these playlists via URLs or through our app to remote employees' desktops or home office screens. A remote rep in Chicago can see the exact same live Salesforce leaderboard display as the HQ team in New York.
Connect multiple data sources through 100+ apps
Sales performance often relies on data outside of Salesforce. Maybe your call data is in Aircall, your project tracking is in Trello, or your marketing stats are in Google Analytics. RocketScreens integrates with over 100 applications. You can display your Salesforce performance dashboard for teams right next to your marketing lead flow or your customer support ticket volume, creating a holistic view of the business.
Positioning: Think of it this way, RocketRankings builds the rankings. RocketScreens makes them visible, shareable, and impossible to ignore.
Real Examples of Salesforce RocketRankings You Can Show on Screens
To get the most out of this setup, you need to know what to display. Here are specific examples of Salesforce RocketRankings that look great on digital signage and drive specific behaviors.
Daily sales leaderboard
This is the classic view. A simple ranked list of reps based on the primary metric of the month (usually Revenue or Deals Closed). It should show the Rep’s Name, their Photo (for personalization), the Total Value, and their Rank.
- Why it works: It provides instant status recognition.
Calls and activity rankings
For SDRs (Sales Development Representatives), revenue is a lagging metric. Activity is what matters today. Create a dashboard that ranks reps by "Calls Made Today" or "Talk Time."
- Why it works: It drives hustle and high-volume activity, which fills the funnel.
Pipeline and forecast stack rankings
This visualization shows how much potential revenue each rep is holding. It often uses a stacked bar chart. It helps managers see who is "sandbagging" and who has a dangerously thin pipeline.
- Why it works: It encourages reps to add new opportunities constantly, not just close existing ones.
Monthly revenue scoreboard
This is the big picture. A gauge chart or a progress bar showing the entire team's progress toward the monthly quota. "We are at $80k of our $100k goal."
- Why it works: It fosters teamwork. Everyone is contributing to filling that single bar.
Region vs. region competition wall
If you have multiple offices or territories, pit them against each other. "East Coast vs. West Coast."
- Why it works: It builds tribal camaraderie within the sub-teams.
Rep achievements and milestones
Use RocketScreens to trigger a celebration when a milestone is hit. When a rep hits 100% of their quota, the screen can take over to display a "Congratulations" message.
- Why it works: Public recognition is a massive morale booster.
Benefits for Sales Teams and Leaders
Implementing Salesforce RocketRankings via RocketScreens isn't just about pretty graphics; it's a business strategy with tangible ROI.
Team alignment
Everyone knows the goal. Everyone knows the score. There is no ambiguity about what is expected. When marketing, sales, and support all see the same numbers, the organization moves in the same direction.
Faster decision-making
Managers can glance at the TV and know immediately if the day is going well or poorly. If the "Calls Made" metric is low at 2:00 PM, a manager can rally the team immediately. You don't have to wait for a weekly report to spot a slump.
Culture of accountability
When your name is on the board, you own your number. It removes the ability to hide poor performance. This naturally filters the team, high performers love it, and low performers are forced to step up or self-select out.
Better forecasting discipline
Because the data is public, reps are more likely to keep their Salesforce data clean. No one wants to be at the bottom of the leaderboard just because they forgot to update a "Closed Won" deal. The visible display drives better data entry habits.
Motivated reps
Salespeople thrive on recognition. Seeing their face at the top of a real-time sales competition board provides a dopamine hit that money alone can't buy. It validates their hard work in front of their peers.
Stronger performance rhythm
The office develops a rhythm. The morning glance at the board sets the tone. The midday check-in assesses progress. The end-of-day review offers closure. This rhythm builds discipline and consistency, which are the hallmarks of high-growth sales teams.
FAQs
What is Salesforce RocketRankings?
Salesforce RocketRankings refers to the configuration of reports and dashboards within Salesforce to create competitive leaderboards and performance tiers. It turns standard data into ranked lists to motivate teams.
How do I display Salesforce dashboards on a TV?
You can use RocketScreens. Our platform connects securely to your Salesforce account and allows you to cast your dashboards to any TV using an Amazon Fire Stick, Google Chromecast, or any web browser.
Does RocketScreens replace Salesforce?
No. RocketScreens is a visibility tool. It pulls data from Salesforce. Your team still works inside Salesforce; RocketScreens just ensures the data they generate is visible to everyone.
Can I schedule playlists of Salesforce dashboards?
Yes. You can schedule specific dashboards to show at specific times (e.g., show the "Morning Call List" from 8 AM to 10 AM, and the "Closing Leaderboard" from 4 PM to 5 PM).
How often do the metrics refresh?
You can control the refresh rate within RocketScreens. Whether you want updates every minute or every hour, the system ensures the data on the screen matches the reality in Salesforce.
Is it secure?
Absolutely. RocketScreens uses enterprise-grade security to connect to your applications. We do not store your data; we simply display it. You control who has access to the screens and the content.
Bring Your Data to Life
Data that sits in the dark cannot help you grow. Your team is working hard, and your Salesforce instance is full of valuable insights, but if those insights are hidden behind tabs and login screens, you are leaving performance on the table.
Salesforce RocketRankings provides the structure for high performance, but RocketScreens provides the spark. By putting your metrics on the wall, you create an environment of transparency, accountability, and excitement.
Don't let your dashboards gather dust. Show your Salesforce RocketRankings live on screens and keep your team aligned all day.
Try RocketScreens today or book a quick demo to see how easy it is to turn your sales data into a powerful motivator.


