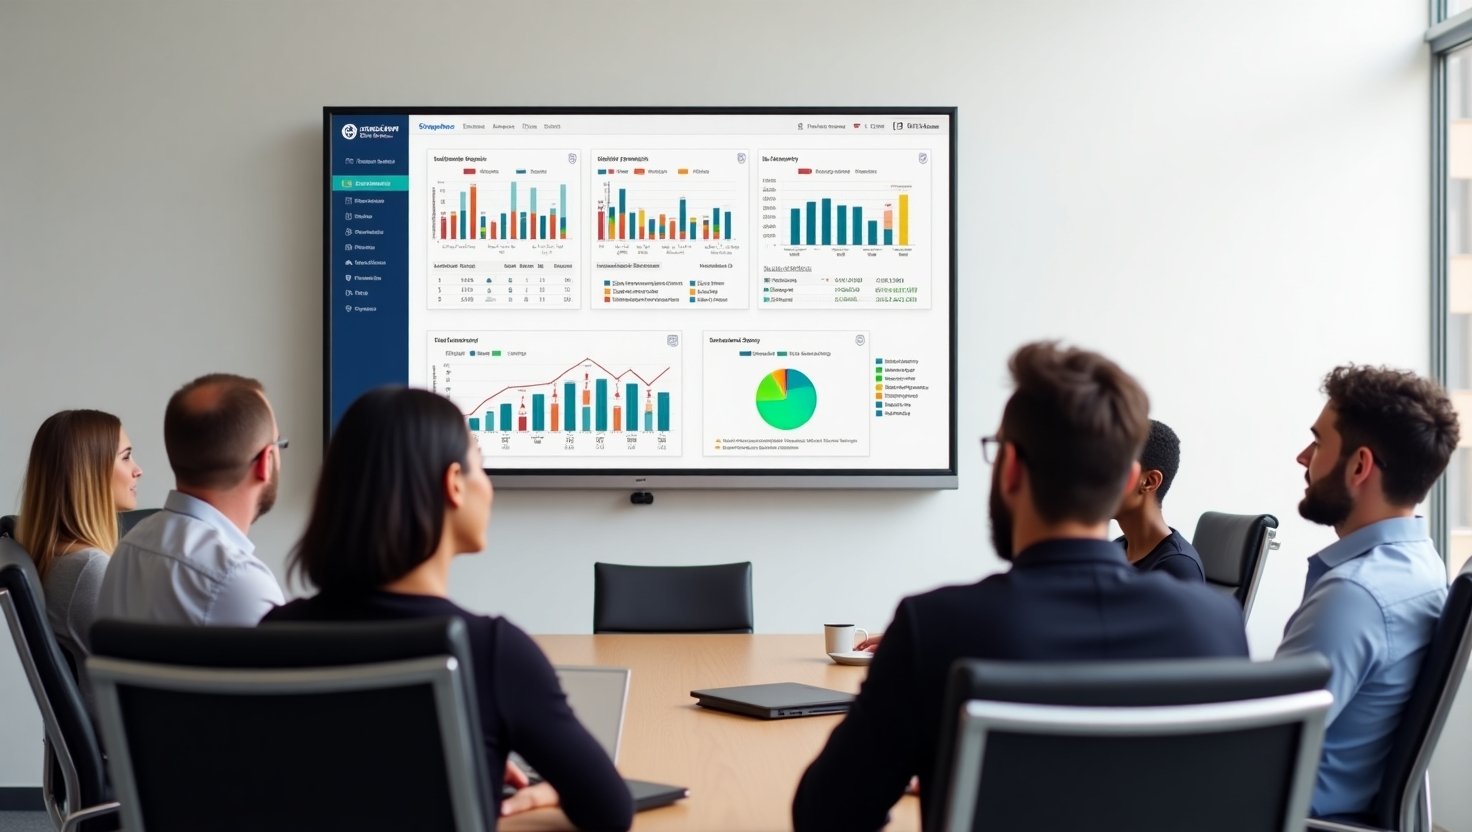
Do you want to see your team's performance, project progress, and key business metrics at a glance? Screenful offers a powerful way to turn your data into visual dashboards. When you connect Screenful with a digital signage platform like RocketScreens, you can display this data on any screen, in any location. The right Screenful digital signage setup can transform how your team works, communicates, and collaborates. It moves important information from hidden spreadsheets and behind-the-scenes reports to a prominent, shared space where everyone can see it.
This guide will walk you through the essential features of Screenful and show you 10 practical ways to use Screenful digital signage to improve your business operations.
Table of Contents
- What is Screenful? A Dashboarding Tool for Your Data
- The Benefits of Visualizing Data with Screenful Digital Signage
- 10 Powerful Ways to Use Screenful Digital Signage
- 1. Visualizing Project Management
- 2. Monitoring Customer Support Performance
- 3. Tracking Sales and Marketing Goals
- 4. Displaying Key Financial Metrics
- 5. Sharing Business Intelligence Dashboards
- 6. Monitoring Sprints and Agile Workflows
- 7. Presenting Company-Wide OKRs
- 8. Motivating Your Team with Leaderboards
- 9. Showing Real-Time Website Analytics
- 10. Communicating Internal Information
- How to Get Started with Screenful and RocketScreens
- Choosing the Right Metrics to Display
- Security and Compliance for Your Data
- Beyond the Basics: Advanced Tips for Your Screenful Setup
- Conclusion: A Powerful Approach to Data Communication
1. What is Screenful? A Dashboarding Tool for Your Data
Screenful is a data visualization and reporting service designed to make complex data easy to understand. It connects to various business applications, including project management tools, CRM platforms, and analytics software. Instead of sifting through raw data, Screenful generates clean, visual dashboards that provide a clear overview of your operations.
The service is particularly popular with teams using tools like Jira, Trello, and Asana. It pulls data directly from these sources to create real-time reports on project status, team workload, and performance. By taking this information and displaying it on a large screen with a service like RocketScreens, you create a central hub for information.
A single glance at your Screenful digital signage can tell you where a project stands, what tasks are late, and who needs help.
2. The Benefits of Visualizing Data with Screenful Digital Signage
Displaying data on a screen isn't just about making things look nice. It's a strategic move that offers several key benefits:
- Improved Transparency: When everyone can see the same data, there’s no confusion about progress or priorities. This transparency builds trust and accountability.
- Real-Time Awareness: Dashboards refresh automatically, so the information is always current. This allows teams to react quickly to changes or issues as they arise.
- Enhanced Collaboration: A shared visual reference point helps teams discuss progress and challenges more effectively. It simplifies meetings and helps people get on the same page faster.
- Increased Motivation: Seeing progress in real-time can be a powerful motivator. Team members feel a sense of accomplishment as they see their work contribute to the overall goals.
- Data-Driven Decisions: With clear data in front of them, leaders can make more informed decisions about resource allocation, project timelines, and strategic direction.
These benefits make a strong case for using Screenful digital signage as a core part of your team's workflow.
3. 10 Powerful Ways to Use Screenful Digital Signage
Here are specific, actionable ways you can put Screenful to work in your organization.
1. Visualizing Project Management
Screenful integrates with popular project management tools like Jira, Trello, and Asana. You can create dashboards that show:
- Tasks in progress, completed, and pending.
- Team workload distribution.
- Burndown charts for agile sprints.
- Gantt charts to track project timelines.
A large monitor in your office displaying a Screenful digital signage dashboard of your current projects helps keep everyone aligned and focused.
2. Monitoring Customer Support Performance
Customer support is a numbers-driven field. Use Screenful to connect to your support platform and show:
- The number of open tickets.
- Average response and resolution times.
- Customer satisfaction scores.
- Ticket backlog trends.
This provides a clear view of your support team's efficiency and helps them manage their workload effectively.
3. Tracking Sales and Marketing Goals
Displaying sales and marketing dashboards can create a competitive and motivating environment. Create dashboards that show:
- Sales funnels and conversion rates.
- Monthly or quarterly sales targets versus actual performance.
- Website traffic and lead generation numbers.
- Marketing campaign performance metrics.
A sales team can stay focused on their goals with real-time updates on a Screenful digital signage screen.
4. Displaying Key Financial Metrics
While some financial data is confidential, key performance indicators (KPIs) can be shared to keep a team informed. You could display dashboards that show:
- Monthly recurring revenue (MRR).
- Customer churn rate.
- Budget vs. actual spending for a project.
- Profitability trends over time.
This fosters a sense of financial awareness across the organization.
5. Sharing Business Intelligence Dashboards
Screenful can connect to business intelligence tools, allowing you to share high-level strategic information. You can display dashboards that summarize:
- Market share trends.
- Overall business health metrics.
- Operational efficiency data.
This helps leaders and managers stay on top of the big picture. For more on this, check out resources on the importance of real-time data in decision-making.
6. Monitoring Sprints and Agile Workflows
For development teams, Screenful is a go-to tool for agile dashboards. Use it to display:
- Sprint burndown and burnup charts.
- Velocity charts to track a team's output over time.
- Epic and story progress.
This visual feedback loop is crucial for agile methodologies and helps teams adjust their work in real-time.
7. Presenting Company-Wide OKRs
OKRs (Objectives and Key Results) are a popular framework for setting and tracking company goals. Screenful allows you to create dashboards that show the progress of company-wide objectives. When a team sees how their daily work contributes to a larger goal, it can significantly improve engagement. Displaying these on your Screenful digital signage ensures everyone is aware of the company's direction.
8. Motivating Your Team with Leaderboards
Sometimes, a little friendly competition is a great motivator. You can create dashboards that display leaderboards for:
- Number of sales calls made.
- Tickets closed by a support agent.
- User engagement on a new product feature.
This can make work more fun and rewarding.
9. Showing Real-Time Website Analytics
Knowing how your website is performing is critical for marketing teams. A Screenful dashboard can connect to services like Google Analytics to display:
- Current website traffic.
- Top-performing pages.
- Visitor locations and demographics.
This data helps marketing teams make quick decisions about campaigns and content.
10. Communicating Internal Information
Beyond data, Screenful can be used to display simple, non-metric information. Think of it as a dynamic bulletin board. You can show:
- Upcoming company events or holidays.
- Team member birthdays or anniversaries.
- Important company announcements.
This use of Screenful digital signage helps build a stronger company culture.
4. How to Get Started with Screenful and RocketScreens
Combining Screenful with RocketScreens is a straightforward process.
- Create your Screenful dashboards: Log into your Screenful account and connect the apps you want to monitor (e.g., Jira, Asana, etc.). Design your dashboards to display the metrics that are most important to you.
- Generate a shareable link: Screenful provides a public, shareable URL for each dashboard. You can also generate a secure, private URL if needed.
- Add the link to RocketScreens: Go to your RocketScreens account and create a new content item. Select the web page or URL app and paste your Screenful dashboard link.
- Schedule and display: Assign the new Screenful content to a player or group of players and set up a schedule. Your dashboards will now be live on your screens.
This seamless integration allows you to get your data on a screen in minutes. For more information on how our platform works, feel free to browse our knowledge base.
5. Choosing the Right Metrics to Display
While it's exciting to display all your data, it's important to be selective. Too much information can be overwhelming and lose its impact. When choosing what to show on your Screenful digital signage, consider these questions:
- Who is the audience? What information is most relevant to the people who will see this screen?
- What is the goal? Are you trying to motivate, inform, or drive a specific action?
- Is the data actionable? Does the information displayed help the team make better decisions or improve their work?
Focus on displaying 3-5 key metrics per dashboard to ensure clarity and impact.
6. Security and Compliance for Your Data
Data security is a top priority. When using Screenful and RocketScreens, your data is handled with care. Screenful connects to your apps using secure, read-only permissions, so your source data remains safe. RocketScreens ensures that the dashboard link you provide is displayed securely on your screens. If you need to restrict access, you can use Screenful's private URL feature to ensure only authorized users can view the content.
7. Beyond the Basics: Advanced Tips for Your Screenful Setup
Once you're comfortable with the basics, here are a few advanced tips:
- Rotate Dashboards: Use RocketScreens' scheduling features to rotate through multiple Screenful dashboards on a single screen. This lets you show different data sets throughout the day or week without needing multiple monitors.
- Combine with Other Content: A Screenful digital signage dashboard doesn't have to be the only thing on your screen. You can use RocketScreens to display your dashboards alongside company announcements, weather updates, news feeds, and more.
- Customize Your Visuals: Screenful offers customization options for your dashboards, allowing you to match them to your brand's colors or highlight specific metrics with conditional formatting.
8. A Powerful Approach to Data Communication
Using Screenful digital signage with a reliable platform like RocketScreens is more than just a convenience—it’s a strategic choice for businesses that want to be data-driven and transparent. It puts critical information front and center, helping teams work better together, stay motivated, and make faster, more informed decisions. By following the tips in this guide, you can create a dynamic and effective communication tool that serves as the heartbeat of your team's operations.
With 7 years of experience in digital marketing, I've seen firsthand how powerful data visualization can be. It's the difference between a team that's guessing and one that's operating with clarity. Screenful on a digital screen is a solution that delivers that clarity every day.


