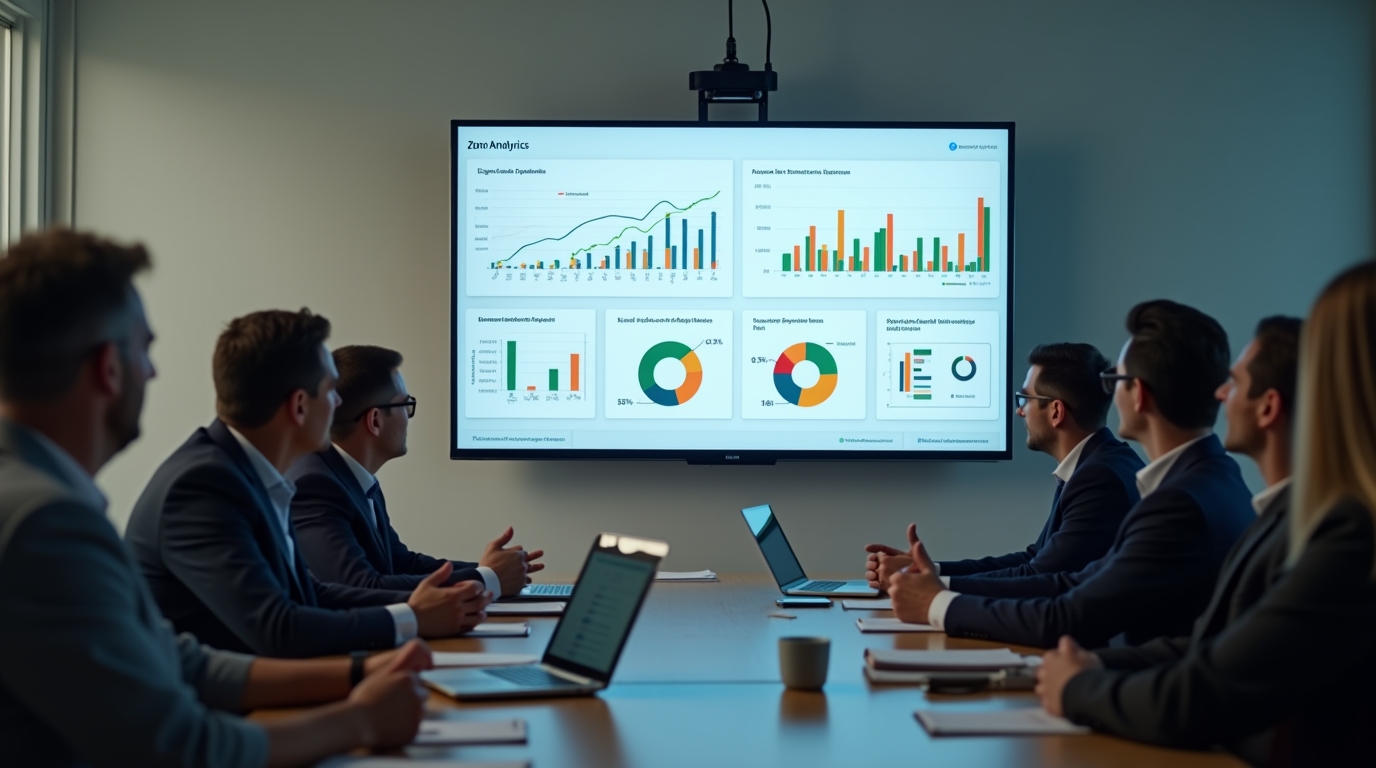
Zoho Analytics dashboards on TV can bridge the gap between data availability and real-time action. While Zoho Analytics provides powerful reporting and visualization capabilities, most teams still rely on static or manually accessed dashboards. This creates delays in decision-making. By moving dashboards onto always-on screens, organizations can make key metrics visible throughout the day and enable faster, more informed responses.
What Zoho Analytics Does Well
Zoho Analytics is a robust business intelligence platform designed to help teams collect, analyze, and visualize data from multiple sources. It supports integrations across CRM systems, marketing platforms, finance tools, and databases.
Key capabilities include:
- Custom dashboard creation with drag-and-drop interfaces
- Live data connectivity through direct database queries
- Automated data refresh schedules
- AI-assisted insights and forecasting
- Cross-functional reporting for sales, operations, and finance
For analysts and managers, these features provide strong control over data exploration and reporting. Teams can identify trends, monitor performance, and generate insights across the organization. However, access to these insights still depends on user behavior.
The Problem with Static and On-Demand Reports
Even when dashboards are technically “live,” they are often treated as static reports in practice. Teams must log in, navigate to the dashboard, and interpret the data before taking action.
This introduces several operational challenges:
- Delayed visibility: Data is only seen when someone chooses to open it
- Manual effort: Reports require active checking rather than passive awareness
- Missed updates: Critical changes can go unnoticed during busy workdays
- Meeting dependency: Teams rely on scheduled reviews instead of continuous monitoring
These limitations are not caused by the analytics platform itself, but by how the data is delivered and consumed. As a result, organizations often react to problems after they escalate rather than addressing them in real time.
Why Live KPI Screens Change Team Behavior
Displaying Zoho Analytics dashboards on TV screens fundamentally changes how teams interact with data. Instead of requiring action to access insights, the data becomes part of the physical workspace.
This shift creates several advantages:
- Continuous visibility: Metrics are always present without requiring login
- Faster response times: Teams can react immediately to changes
- Shared awareness: Everyone sees the same data at the same time
- Reduced reporting friction: Less need for manual updates or status meetings
When performance metrics are visible throughout the day, they become part of daily decision-making rather than periodic review.
Business Impact of Always-On Dashboards
Moving from static reports to live screens has measurable operational benefits across departments.
Sales Teams
Sales teams can monitor pipeline changes, deal progress, and daily targets in real time. This helps managers identify gaps early and adjust priorities during the day instead of waiting for end-of-week reviews.
Customer Support
Support teams benefit from live ticket volumes, response times, and SLA tracking. Immediate visibility allows teams to rebalance workloads and prevent service delays.
Operations
Operational metrics such as production output, delivery timelines, or system uptime can be tracked continuously. This improves coordination and reduces bottlenecks.
Executive Leadership
Leadership teams gain a real-time pulse of the business without needing to request updates. This supports faster strategic decisions and improves alignment across departments.
How RocketScreens Extends Zoho Analytics
Zoho Analytics excels at data processing and dashboard creation. RocketScreens focuses on delivering that data where it matters most—on shared screens across the organization.
RocketScreens acts as a presentation layer that transforms dashboards into live, always-visible displays.
Key capabilities include:
- Automatic dashboard refresh without manual intervention
- Centralized control of multiple screens across locations
- Secure cloud-based architecture for enterprise environments
- Compatibility with dashboards, reports, and web-based data sources
- Scalable deployment across offices, floors, or regions
This approach ensures that data is not just available, but actively used throughout the day.
Implementation: From Dashboard to Live Screen
Deploying Zoho Analytics dashboards on TV screens does not require major infrastructure changes. A structured approach ensures smooth adoption.
Step 1: Identify Key Metrics
Focus on metrics that require immediate attention or frequent monitoring. Examples include:
- Daily sales targets
- Support ticket queues
- Marketing campaign performance
- Operational KPIs
Step 2: Optimize Dashboard Design
Dashboards intended for TV screens should be simple and highly visual. Avoid clutter and prioritize readability from a distance.
Step 3: Connect to RocketScreens
Use RocketScreens to display dashboards on screens with automatic refresh and centralized control.
Step 4: Deploy Across Locations
Roll out screens in high-visibility areas such as:
- Sales floors
- Support centers
- Operations hubs
- Executive offices
Step 5: Establish Monitoring Culture
Encourage teams to use live screens as part of their daily workflow rather than relying solely on reports or meetings.
Common Challenges and How to Solve Them
While the benefits are clear, organizations may face challenges when implementing live dashboards.
Information Overload
Too many metrics on a single screen can reduce clarity. Focus on high-impact KPIs and rotate additional data if needed.
Lack of Ownership
Assign responsibility for each dashboard to ensure data accuracy and relevance.
Poor Screen Placement
Screens must be placed in areas where teams naturally spend time. Visibility drives engagement.
Data Latency Concerns
Ensure that dashboards are connected to live or frequently refreshed data sources to maintain trust in the displayed information.
Best Practices for Live Dashboard Success
Organizations that succeed with live KPI screens follow consistent best practices:
- Keep dashboards focused and easy to interpret
- Update metrics in real time or near real time
- Align dashboards with team-specific goals
- Use consistent visual formats across departments
- Review and refine dashboards regularly
These practices ensure that screens remain useful rather than becoming background noise.
Mistakes to Avoid
Several common mistakes can limit the effectiveness of live dashboards:
- Displaying too much data without prioritization
- Using dashboards designed for desktops instead of screens
- Failing to update metrics frequently
- Ignoring user feedback from teams
- Treating screens as passive displays rather than active tools
A disciplined approach helps avoid these pitfalls and maximizes impact.
Frequently Asked Questions
Can Zoho Analytics dashboards be displayed on TV screens?
Yes, Zoho Analytics dashboards can be displayed on TV screens using tools like RocketScreens, which enable automatic refresh and centralized screen management.
How often should live dashboards refresh?
The refresh rate depends on the use case. Sales and support teams may require near real-time updates, while operational dashboards may refresh every few minutes.
Do live dashboards replace reports?
No, live dashboards complement reports. Reports are useful for deep analysis, while live screens support continuous monitoring and immediate action.
What types of metrics work best on live screens?
Metrics that require frequent attention or quick response are ideal, such as sales performance, ticket queues, and operational KPIs.
Is it difficult to manage multiple screens across locations?
With a centralized platform like RocketScreens, organizations can manage multiple screens across different locations from a single interface.
Make Your Data Visible Where Decisions Happen
Zoho Analytics provides the foundation for data-driven decision-making, but visibility determines how quickly teams can act on that data. By moving dashboards onto live screens, organizations can close the gap between insight and execution.
RocketScreens enables this shift by turning dashboards into always-on performance displays that keep teams aligned and responsive throughout the day.
If your organization relies on Zoho Analytics, the next step is not more reports, it is better visibility.
Book a demo with RocketScreens to see how you can turn your dashboards into real-time operational tools across your entire organization.


