Top 5 to wins with Microsoft Power BI
Microsoft Power BI is a game-changer in the field of reporting visualizations. Turning data and key metrics into visuals that make sense and are easy to read is no small task. But Microsoft and others are up to the challenge of allowing quick Power BI reports and dashboards to be rapidly created and scheduled. This allows power users to quickly publish reporting apps that display KPIs on any system you have allowing your team to stay informed. Displaying dashboards to employees is a powerful solution to informing them of secure insights to get the results your organization expects.
The Microsoft Power BI is the modern cloud platform solution to get the relevant reports to the appropriate teams or user with proper credentials from the power bi apps or any web browser.
Let's face it, data is everywhere. You can't turn on the news or check your email, CRM, or ERP, without being bombarded with numbers that are impossible to understand unless they're in charts and graphs!
But what if I told you there was a program designed just for people who want this type of information at their fingertips? Well now Microsoft Power BI has made its way into our lives and guess what -you don't have to go anywhere near Excel anymore because everything will be right here waiting for you. MS Power BI is a powerful and beautiful tool. Easy to use? It can be. The difficulty is measured in the outcomes desired vs the complexity of the data inputs. All-in-all Microsoft Power BI is a great way to get started with data visualization.
In this blog, I’ll share some inspiring ways to learn and use Microsoft's powerful data visualization software. Pro tip: you can now send reports from any graph or chart into screens around the office so everyone's insight will be able to view the mission-critical intelligence.
Here are my top 5 tips ways to win w/ Power BI
#5 - Become an expert fast!
Get a virtual coach. YouTube is an incredible resource for business tool coaching. Check out Avi Singh - PowerBIPro to get started.
#4 - Make a top 10 list!
Zoom a top 100 analysis of revenue into a top 10 w/ the “TOP N Report”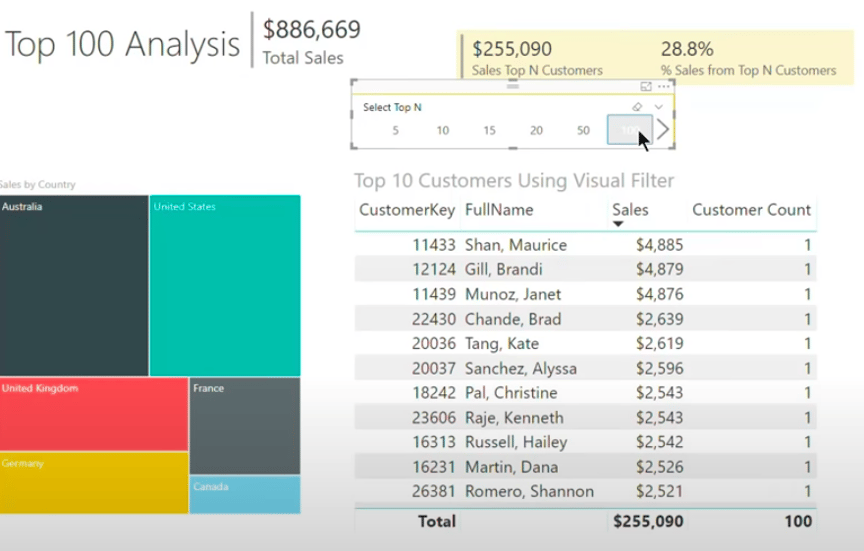
#3 - Turn any graph into a table, quickly
w/ ALT + Shift + F11
Turn this:
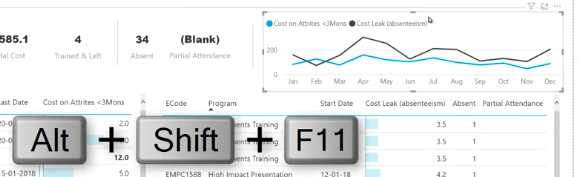
Into this:
LLP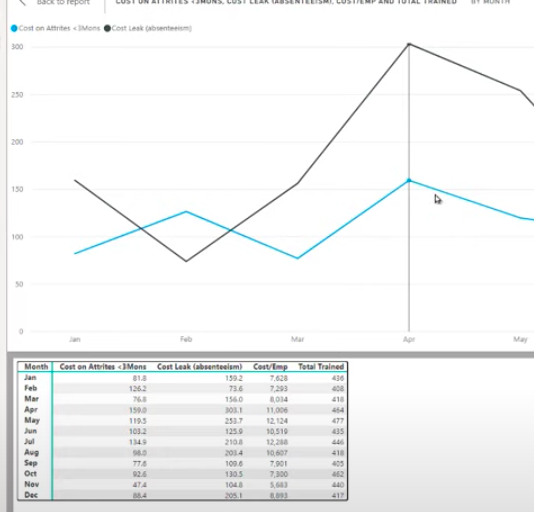
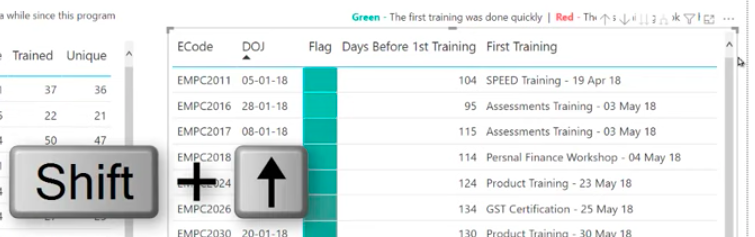
# 2 - Use the TAB key to toggle between elements on the canvas.
This will allow you quickly see is an element and what can be edited. This will also help you visualize what can be moved and repositioned.
Pro tip: Select an element and move it with the arrows on the keyboard. Get bigger movements by holding Shift + Up Arrow
# 1 - DON’T let your hard work and efforts get buried!
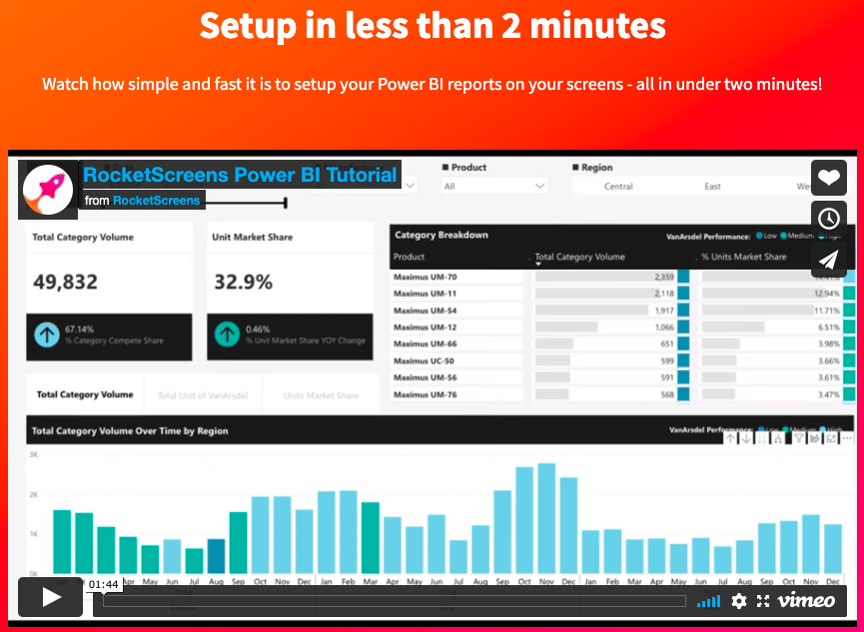
Consider sending your reports to RocketScreens and give those mission-critical reports the attention they deserve. You want to get Microsoft Power BI on any digital screen well RocketScreens is the fastest and most powerful way to do that. Now the dashboards and reports you have created can be quickly added to your digital signage screens to create a learning atmosphere in any office. RocketScreeens has secure integration capabilities that allow you to display your bi dashboard or report anywhere you have a screen. Customers can leverage two main ways either copying a public URL one can access inside the application or securely integrating your Microsoft Power BI instance with a company access token to enable and expose the features built within the applications. Dashboards and reports will be displayed to all your resources instantly via digital screens.
Click the link above and see how easy it is to get your RocketScreens setup.