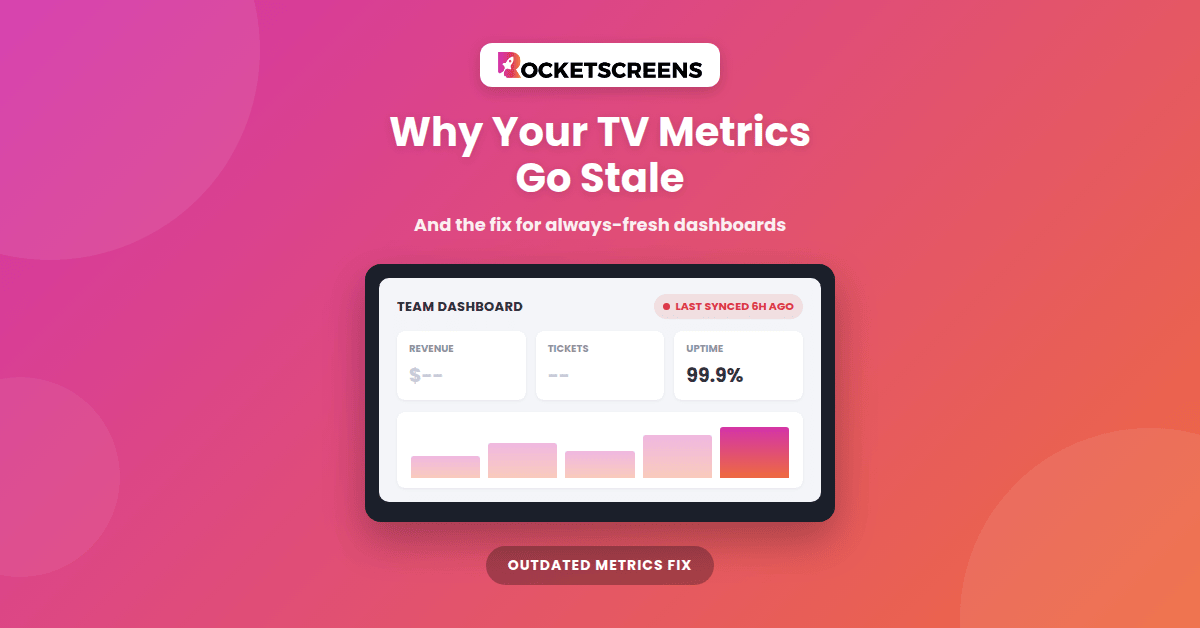
Quick answer: Outdated metrics on enterprise TV screens are almost never a TV problem. They happen because the dashboard on the screen stopped getting new data somewhere along the chain: the data source refreshes less often than people assume, a login session or data credential expired, a cached or "published to web" copy is lagging, the page on the TV never reloads, or the screen lost its network connection and kept showing the last thing it rendered. Fixing it means checking each link in that chain and then putting the screens on a managed platform that refreshes, re-authenticates, and monitors them automatically.
Key takeaways
- A TV dashboard is only as current as its slowest link: source system, BI refresh, published copy, display player, and network.
- The most common culprits are scheduled refresh limits, expired sessions, and pages that load once and never reload.
- The dangerous part is that stale screens look normal. Numbers are still on the wall, they're just wrong.
- Always show a "last updated" timestamp on any KPI screen so people can tell at a glance whether to trust it.
- Browser tabs on smart TVs work for a demo but don't hold up across dozens of screens. Centralized screen management with automatic refresh is what keeps enterprise displays current.
Putting dashboards on office TVs is one of the fastest ways to get a team looking at the same numbers. It's also one of the fastest ways to lose trust in those numbers. The first time a sales manager notices the leaderboard on the wall still shows yesterday's bookings, or an IT lead sees a ticket queue that cleared an hour ago, people stop looking at the screen. This guide explains what causes outdated metrics on enterprise TV screens, how to diagnose which cause you're dealing with, and how to set displays up so they stay current.
Why do TV dashboards show outdated data?
Every number on a TV dashboard travels through a chain before it reaches the screen. It starts in a source system such as Salesforce, HubSpot, Zendesk, Jira, or an ERP. A BI tool like Power BI or Tableau pulls it into a dataset on a schedule. The dashboard renders that dataset. A browser or display player loads the dashboard on the TV. And the TV needs a working network connection the whole time.
A break or delay at any point produces the same symptom: old numbers on the wall. That's why stale screens are hard to troubleshoot. The TV looks fine, the dashboard looks fine, and nothing shows an error. You have to work out which link stopped moving.
What are the 8 most common causes of outdated metrics on TV screens?
1. The data source refreshes less often than people think
Most BI dashboards don't show live data. They show a dataset that was last refreshed on a schedule. In Power BI, for example, datasets on a Pro license can be scheduled to refresh up to 8 times a day, while Premium capacity allows up to 48. Tableau extracts and Salesforce dashboards similarly reflect the last scheduled or manual refresh, not the moment someone looks at the screen. If a dashboard refreshes at 6 AM and 2 PM, a TV showing it at 1:45 PM is showing numbers that are almost eight hours old, and working exactly as configured.
Fix: Match the refresh schedule to how the screen is used. A daily revenue summary can refresh overnight. A support queue or production line display needs near-real-time data, which usually means DirectQuery or live connections, automatic page refresh, or pulling the metric straight from the source app rather than through a scheduled dataset.
2. A scheduled refresh is failing silently
When a scheduled refresh fails, most BI tools keep showing the last successful version of the data. The dashboard doesn't go blank; it just stops changing. Common reasons include an on-premises data gateway that went offline, a service account whose password changed, a data source credential that expired, or a query that started timing out as the data grew.
Fix: Turn on refresh-failure notifications for every dataset that feeds a screen, and send them to a shared inbox or channel rather than to the one person who built the report. Use service accounts with managed credentials instead of personal logins.
3. The login session on the TV expired
Many teams put a dashboard on a TV by opening a browser, logging in, and leaving it. That works until the session token expires, single sign-on requires re-authentication, or a security policy logs the device out. Depending on the app, the screen then shows a login page, an error, or, worst of all, the last page it rendered before the session died.
Fix: Don't depend on an interactive login held open on a TV. Use an integration that authenticates through a managed connection (for example OAuth with read-only permissions) and renews access in the background, so nobody has to walk up to the screen with a keyboard.
4. The page loaded once and never reloaded
A dashboard opened in a browser tab isn't guaranteed to update itself. Some visuals only pull new data when the page is reloaded or when someone interacts with a filter. On a TV nobody touches, the page can sit on its first render for days. Smart TV browsers and power-saving settings can also throttle or suspend background tabs.
Fix: Use a display player that reloads content on a defined interval and rotates through slides on a schedule, instead of a static browser tab. If you must use a browser, configure automatic page refresh in the BI tool where it's supported.
5. A cached or "published to web" copy is lagging
Shortcuts for getting dashboards onto screens often add a caching layer. Public embed links, snapshot images, and exported PDFs all show a copy of the dashboard rather than the dashboard itself, and that copy updates on its own timeline. Power BI's publish-to-web feature, for instance, serves a cached version that can trail the underlying report, and it makes the report publicly accessible to anyone with the link, which most IT and security teams won't accept for internal KPIs.
Fix: Avoid public links and static exports for anything operational. Display the dashboard through a secure, authenticated integration so the screen shows the same version your team sees in the app.
6. The screen lost its network connection
Display players and browsers typically keep showing the last content they loaded when Wi-Fi drops, a switch port fails, or a firewall change blocks a domain. From across the room, a disconnected screen looks exactly like a connected one.
Fix: Use wired connections for fixed displays where possible, whitelist the domains your dashboards and signage platform need, and use a platform that reports each screen's online status centrally so an offline display gets noticed.
7. Filters, date ranges, or views are frozen
Sometimes the data is current but the view isn't. A dashboard saved with a fixed date range, a report filtered to "last month" by whoever set it up, or a slicer left on a single region will show accurate numbers for the wrong period. The screen is live, it's just answering the wrong question.
Fix: Build display-specific versions of dashboards with relative date filters ("today," "this week," "month to date") and no interactive state that depends on a user's last click.
8. Nobody owns the screens
This is the root cause behind most of the others. Dashboards have owners. Data sources have owners. TVs on the wall often don't. When a screen is set up by one person on a laptop and forgotten, there's no one watching for failed refreshes, expired sessions, or dark displays across locations.
Fix: Assign ownership of the display layer, typically to IT or operations, and give that owner one place to see every screen, what it's showing, and whether it's current.
How do you diagnose which cause you're dealing with?
Use this table to narrow it down from what you see on the screen.
| What you see | Likely cause | First check |
|---|---|---|
| TV matches the BI app, but both are hours behind the source system | Refresh schedule too infrequent | Dataset refresh schedule and "last refreshed" time |
| Numbers haven't changed in a day or more | Silent refresh failure | Refresh history, gateway status, data source credentials |
| Screen shows a login page or an error | Expired session or SSO timeout | How the TV authenticates to the app |
| BI app on a laptop is current, TV is not | Page never reloads, or a cached copy | Reload the TV; check whether it uses a public link or snapshot |
| One screen is stale, others in the same office are fine | Network drop or device issue | Screen's online status and connection |
| Data is current but shows the wrong period or region | Frozen filters or fixed date range | Saved filters and date settings on the displayed view |
Why does stale data on TV screens matter so much?
A dashboard in a browser tab that's a few hours old is a minor inconvenience. The same dashboard on a wall is a different problem, because a shared screen is treated as the source of truth for everyone who walks past it.
- Bad decisions spread faster. A support lead staffs the queue based on a backlog that already cleared. A sales team celebrates a target it hasn't hit yet.
- Trust erodes quietly. Once people catch a screen being wrong, they stop looking at it, and the investment in visibility is lost.
- IT inherits the blame. Stale screens generate tickets and hallway complaints even when the root cause is a refresh schedule in someone else's report.
- It scales badly. One stale TV is easy to spot. Forty screens across six offices, each set up differently, are not.
How do you keep metrics on enterprise TV screens current?
Use this checklist when setting up or auditing any KPI display.
- Define freshness per screen. Decide how current each display needs to be (real time, hourly, daily) and set data refresh to match.
- Show a "last updated" timestamp on every KPI screen so viewers can judge the data themselves.
- Use managed authentication, not a personal login held open in a browser.
- Turn on refresh-failure alerts and route them to a shared owner.
- Build display-safe dashboards with relative date filters and no sensitive record-level data.
- Avoid public links and static exports for operational metrics.
- Automate content reload and rotation on the display player.
- Monitor every screen centrally, including online status and what content is playing.
- Assign an owner for the display layer, not just the dashboards.
DIY browser tabs vs. a managed display platform
| Issue | Smart TV browser or laptop on HDMI | Managed digital signage platform |
|---|---|---|
| Content refresh | Depends on the page; often loads once | Automatic refresh and scheduled rotation |
| Authentication | Personal login that expires | Managed integrations with scoped permissions |
| Visibility into screens | Someone has to walk by and look | Central view of every screen and what it's showing |
| Multiple sources on one screen | Manual tab switching | Channels that combine dashboards, apps, and announcements |
| Scaling across offices | Each screen configured by hand | Assign content to screen groups from one console |
How RocketScreens keeps TV dashboards current
RocketScreens is a digital signage and data visualization platform built for exactly this problem. It connects to more than 100 apps, including Power BI, Tableau, Salesforce, HubSpot, Zendesk, Jira, and SharePoint, and broadcasts live content to TVs, desktops, and web players across every location.
Instead of a browser tab someone logged into months ago, each screen runs a RocketScreens player on hardware such as Android, Fire TV, or Google TV devices. Content refreshes automatically, channels rotate dashboards and announcements on a schedule, and IT manages every screen from one central dashboard, so a stale or offline display gets caught by the team that owns it rather than by the people walking past it.
The result is what the screens were supposed to deliver in the first place: everyone looking at the same numbers, and those numbers being right.
Frequently asked questions
Why is my Power BI dashboard not updating on the TV?
The most common reasons are that the dataset's scheduled refresh runs less often than you expect, the last scheduled refresh failed, or the browser on the TV loaded the report once and never reloaded it. Check the dataset's refresh history first, then check how the TV is loading the report.
How often can Power BI dashboards refresh?
Scheduled refresh on a Power BI Pro license allows up to 8 refreshes per day; Premium capacity allows up to 48. For near-real-time displays, teams use DirectQuery or live connections with automatic page refresh, or pull metrics directly from the source application.
Why does my TV dashboard keep asking me to log in?
The browser session or single sign-on token on the TV has expired. Interactive logins aren't designed for unattended screens. A signage platform with managed, read-only integrations avoids the problem because it handles authentication in the background.
Is it safe to use "publish to web" to show dashboards on office TVs?
Generally not for internal business data. Publish-to-web links make a report publicly accessible to anyone who has the link, and they serve a cached copy that can lag the live report. Most IT and security teams require an authenticated method instead.
How can I tell if a TV screen is showing stale data?
Add a visible "last updated" or "data as of" timestamp to every KPI screen. Without one, a stale screen looks identical to a current one. A central screen-management console that shows each display's status also helps.
What's the best way to display live dashboards on multiple office TVs?
Use a centralized digital signage platform that connects directly to your data tools, refreshes content automatically, and lets you assign dashboards to groups of screens across locations. It removes the manual setup and one-off browser tabs that cause most outdated-metric problems.
Stop guessing whether your screens are current
If your team has stopped trusting the numbers on the wall, the fix is usually a few settings and the right display layer. Start a 14-day free trial of RocketScreens or book a demo, and we'll show you how IT and operations teams keep live dashboards current on every screen, in every office, without touching the TVs.